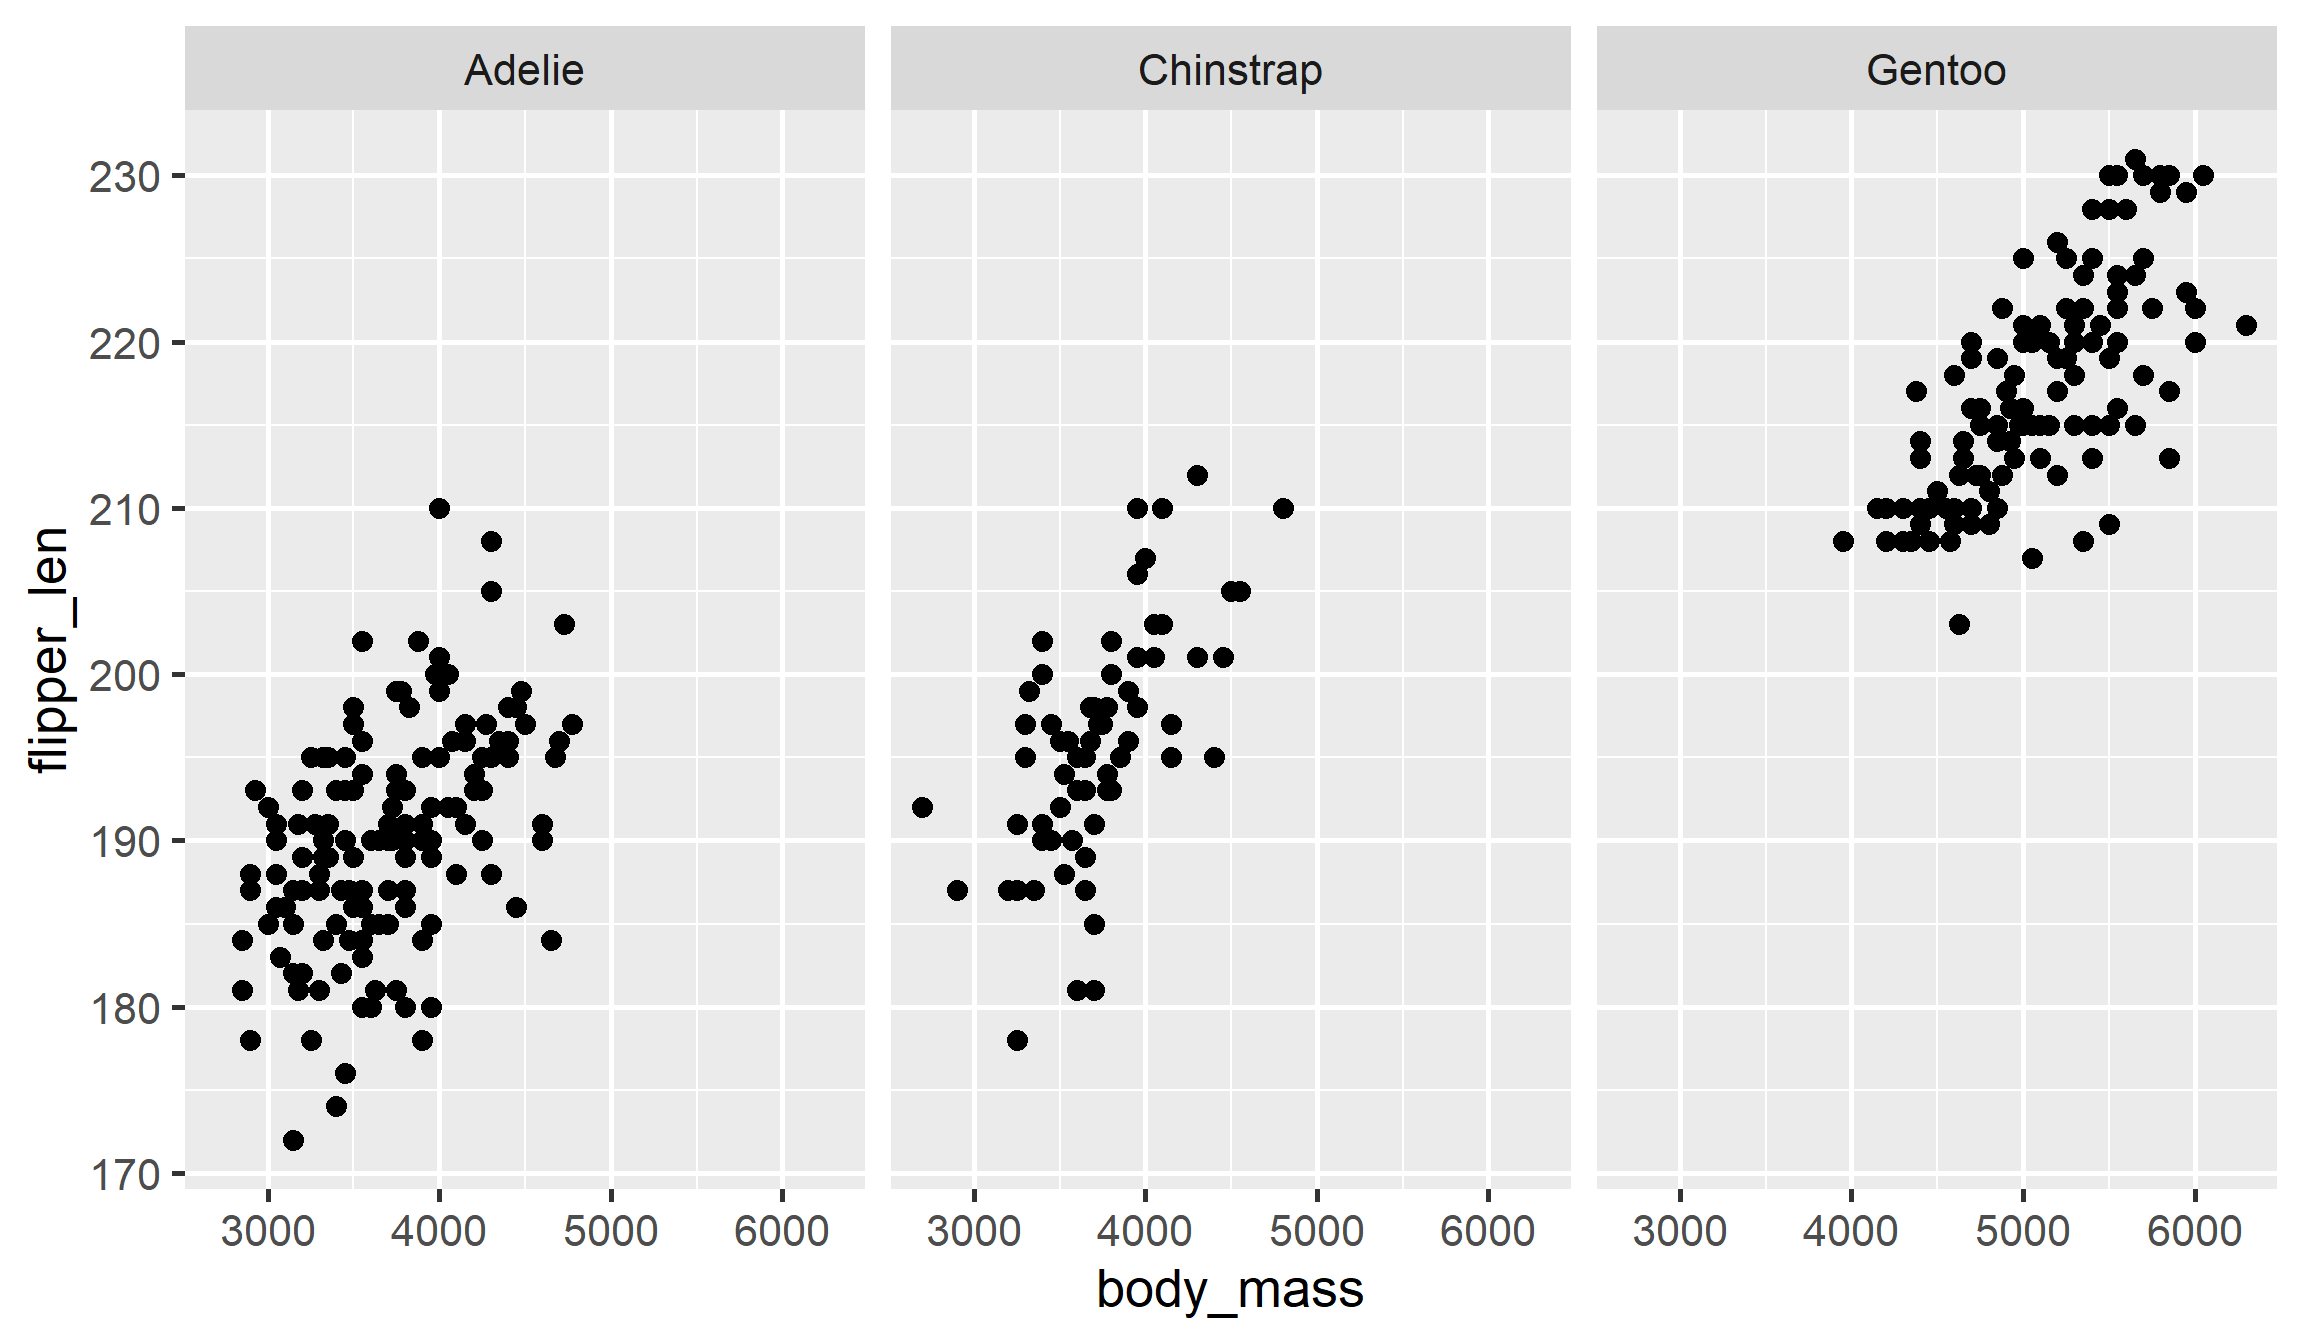
# Create a subplot for each species
p + facet_wrap(facets = vars(species))Foundations of
Data Science
Spring 2026 | Data 2 (399)
Jeffrey M. Girard | Lecture 13a

Setup for Faceting
data("penguins", package = "datasets")
# Drop rows with NAs
penguins2 <- drop_na(penguins)

# Create a base plot to add to
p <-
  ggplot(
    penguins2,
    aes(x = body_mass, y = flipper_len)
  ) +
  geom_point()
p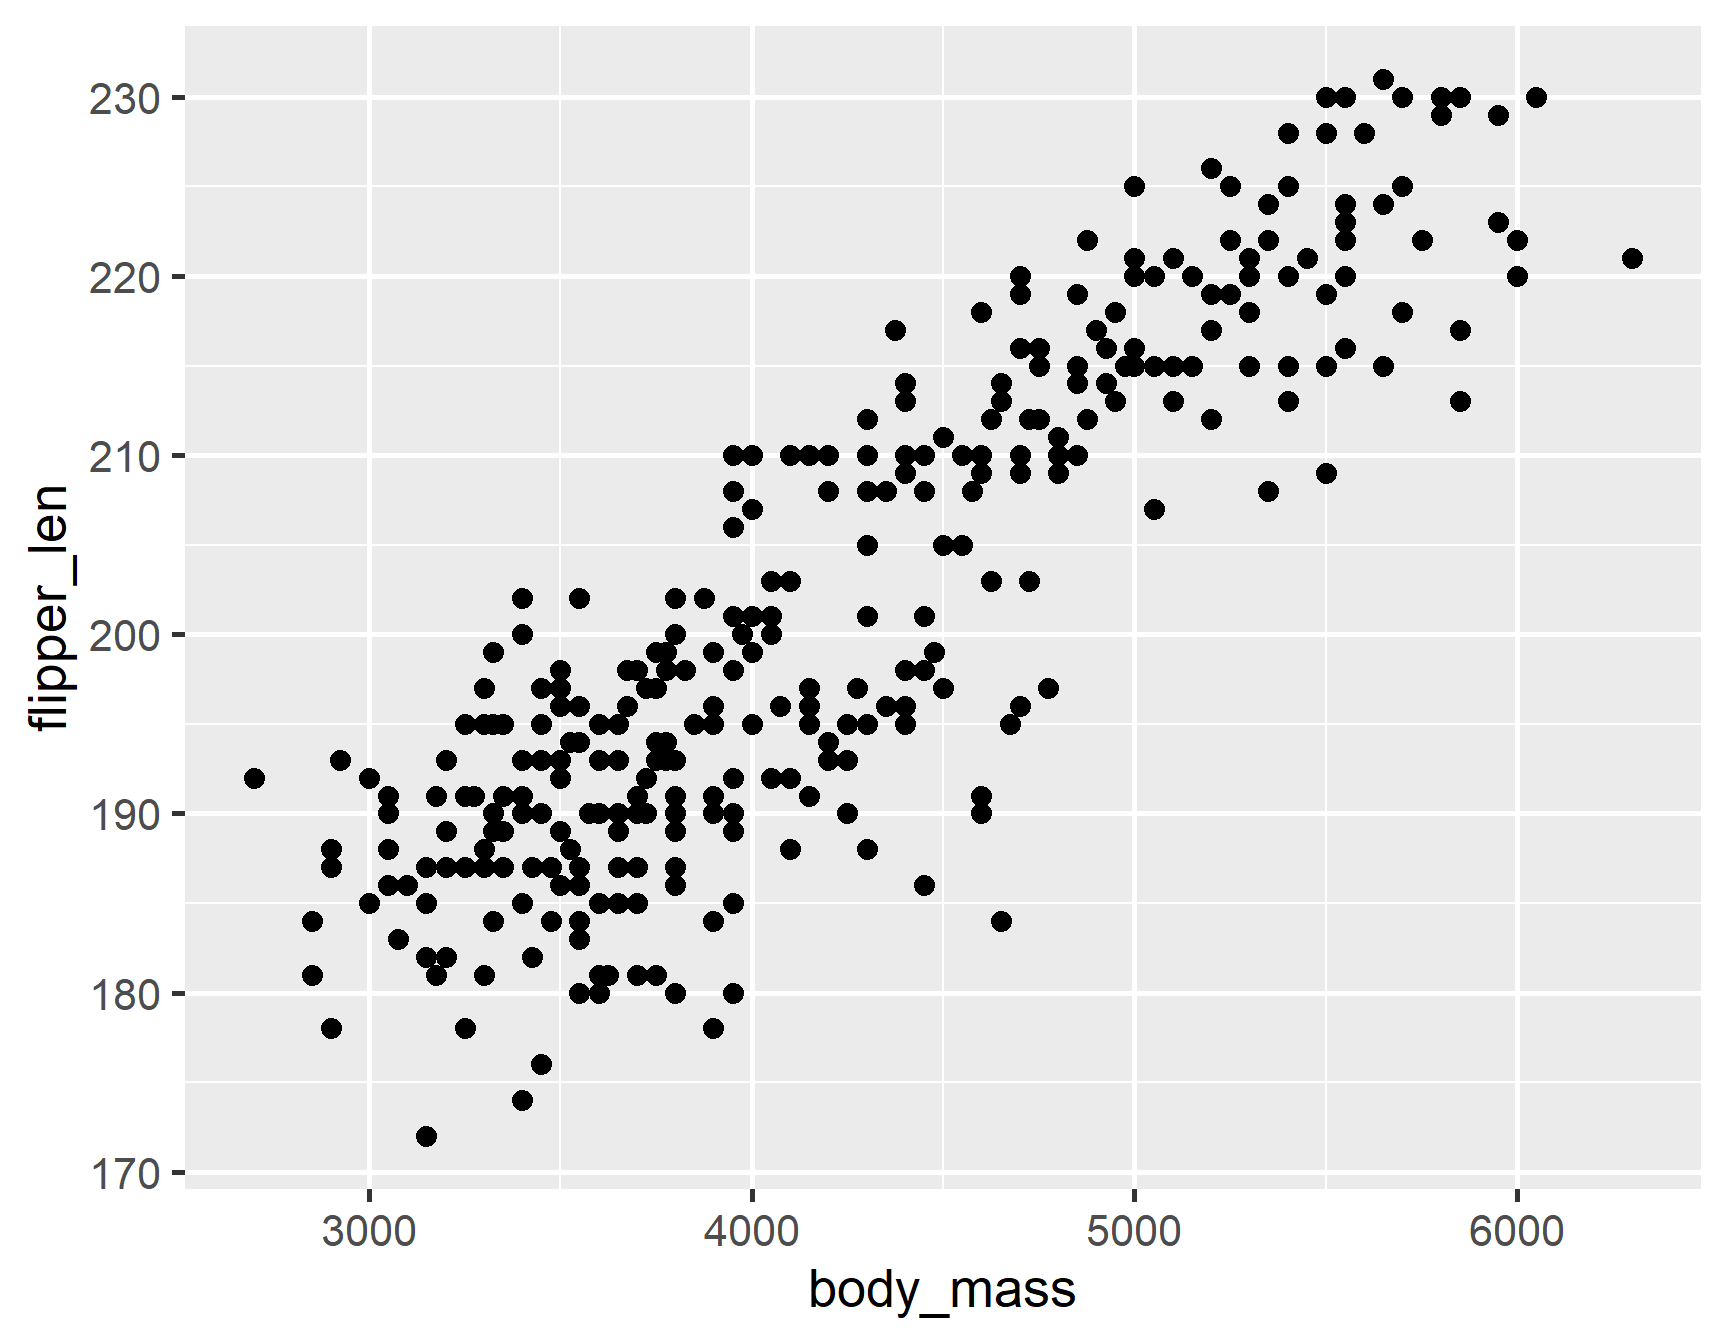
Facet Wrap
Layout Options
# Control the number of columns and rows to wrap across
p + facet_wrap(facets = vars(species), ncol = 2, nrow = 2)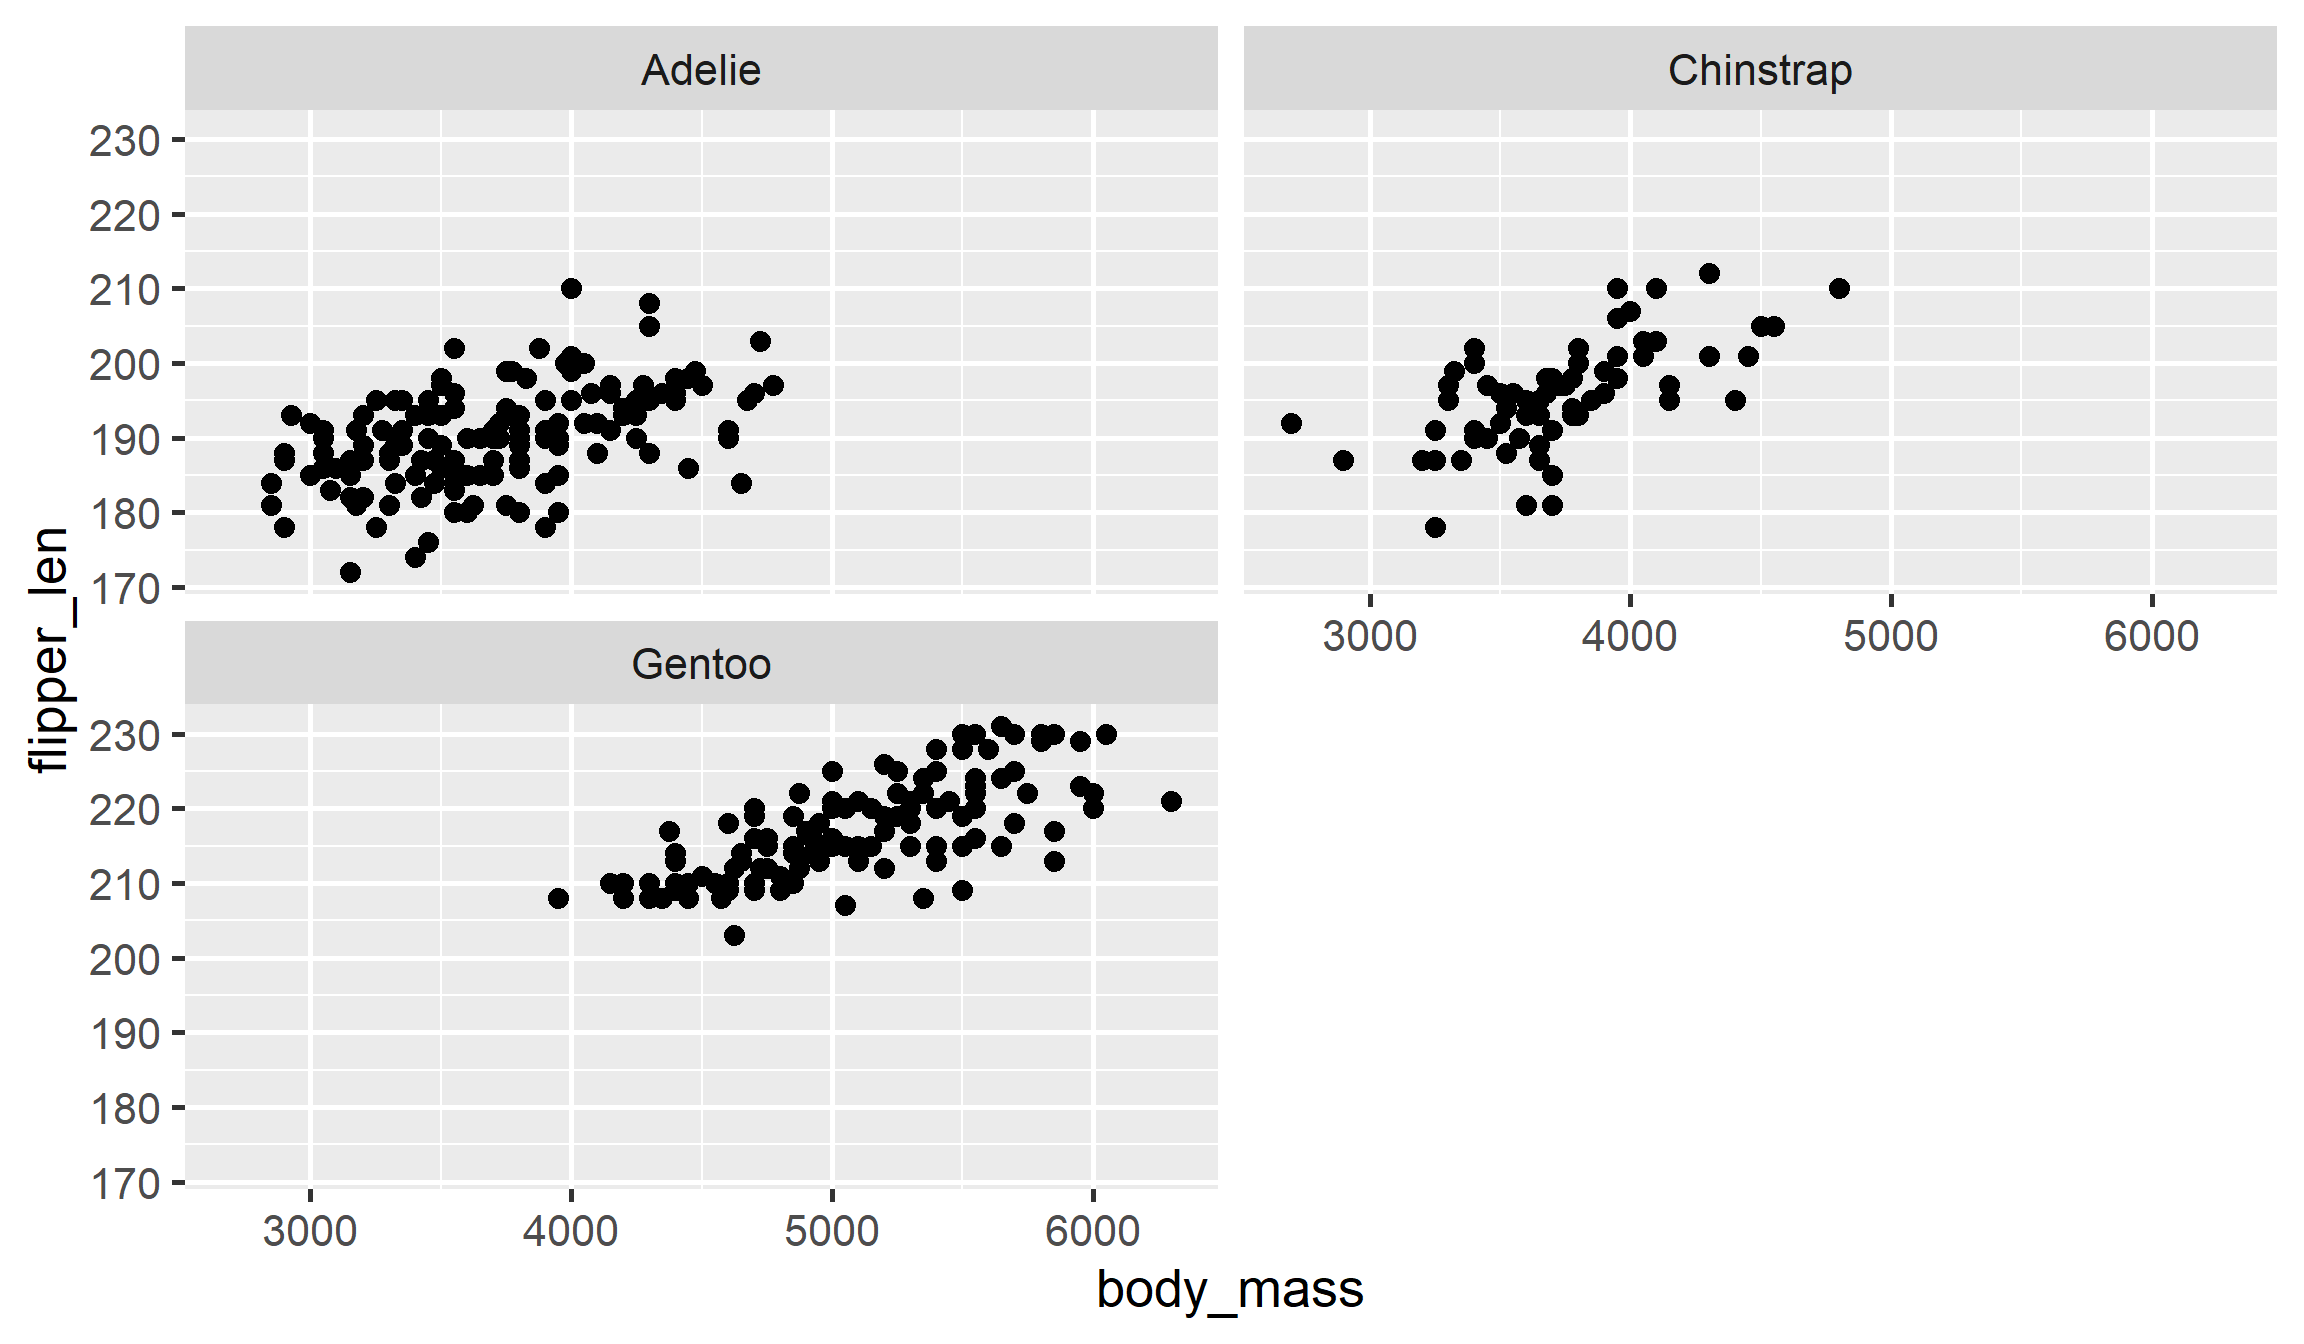
Multiple Variables
# Wrap across combinations of species and sex
p + facet_wrap(facets = vars(species, sex))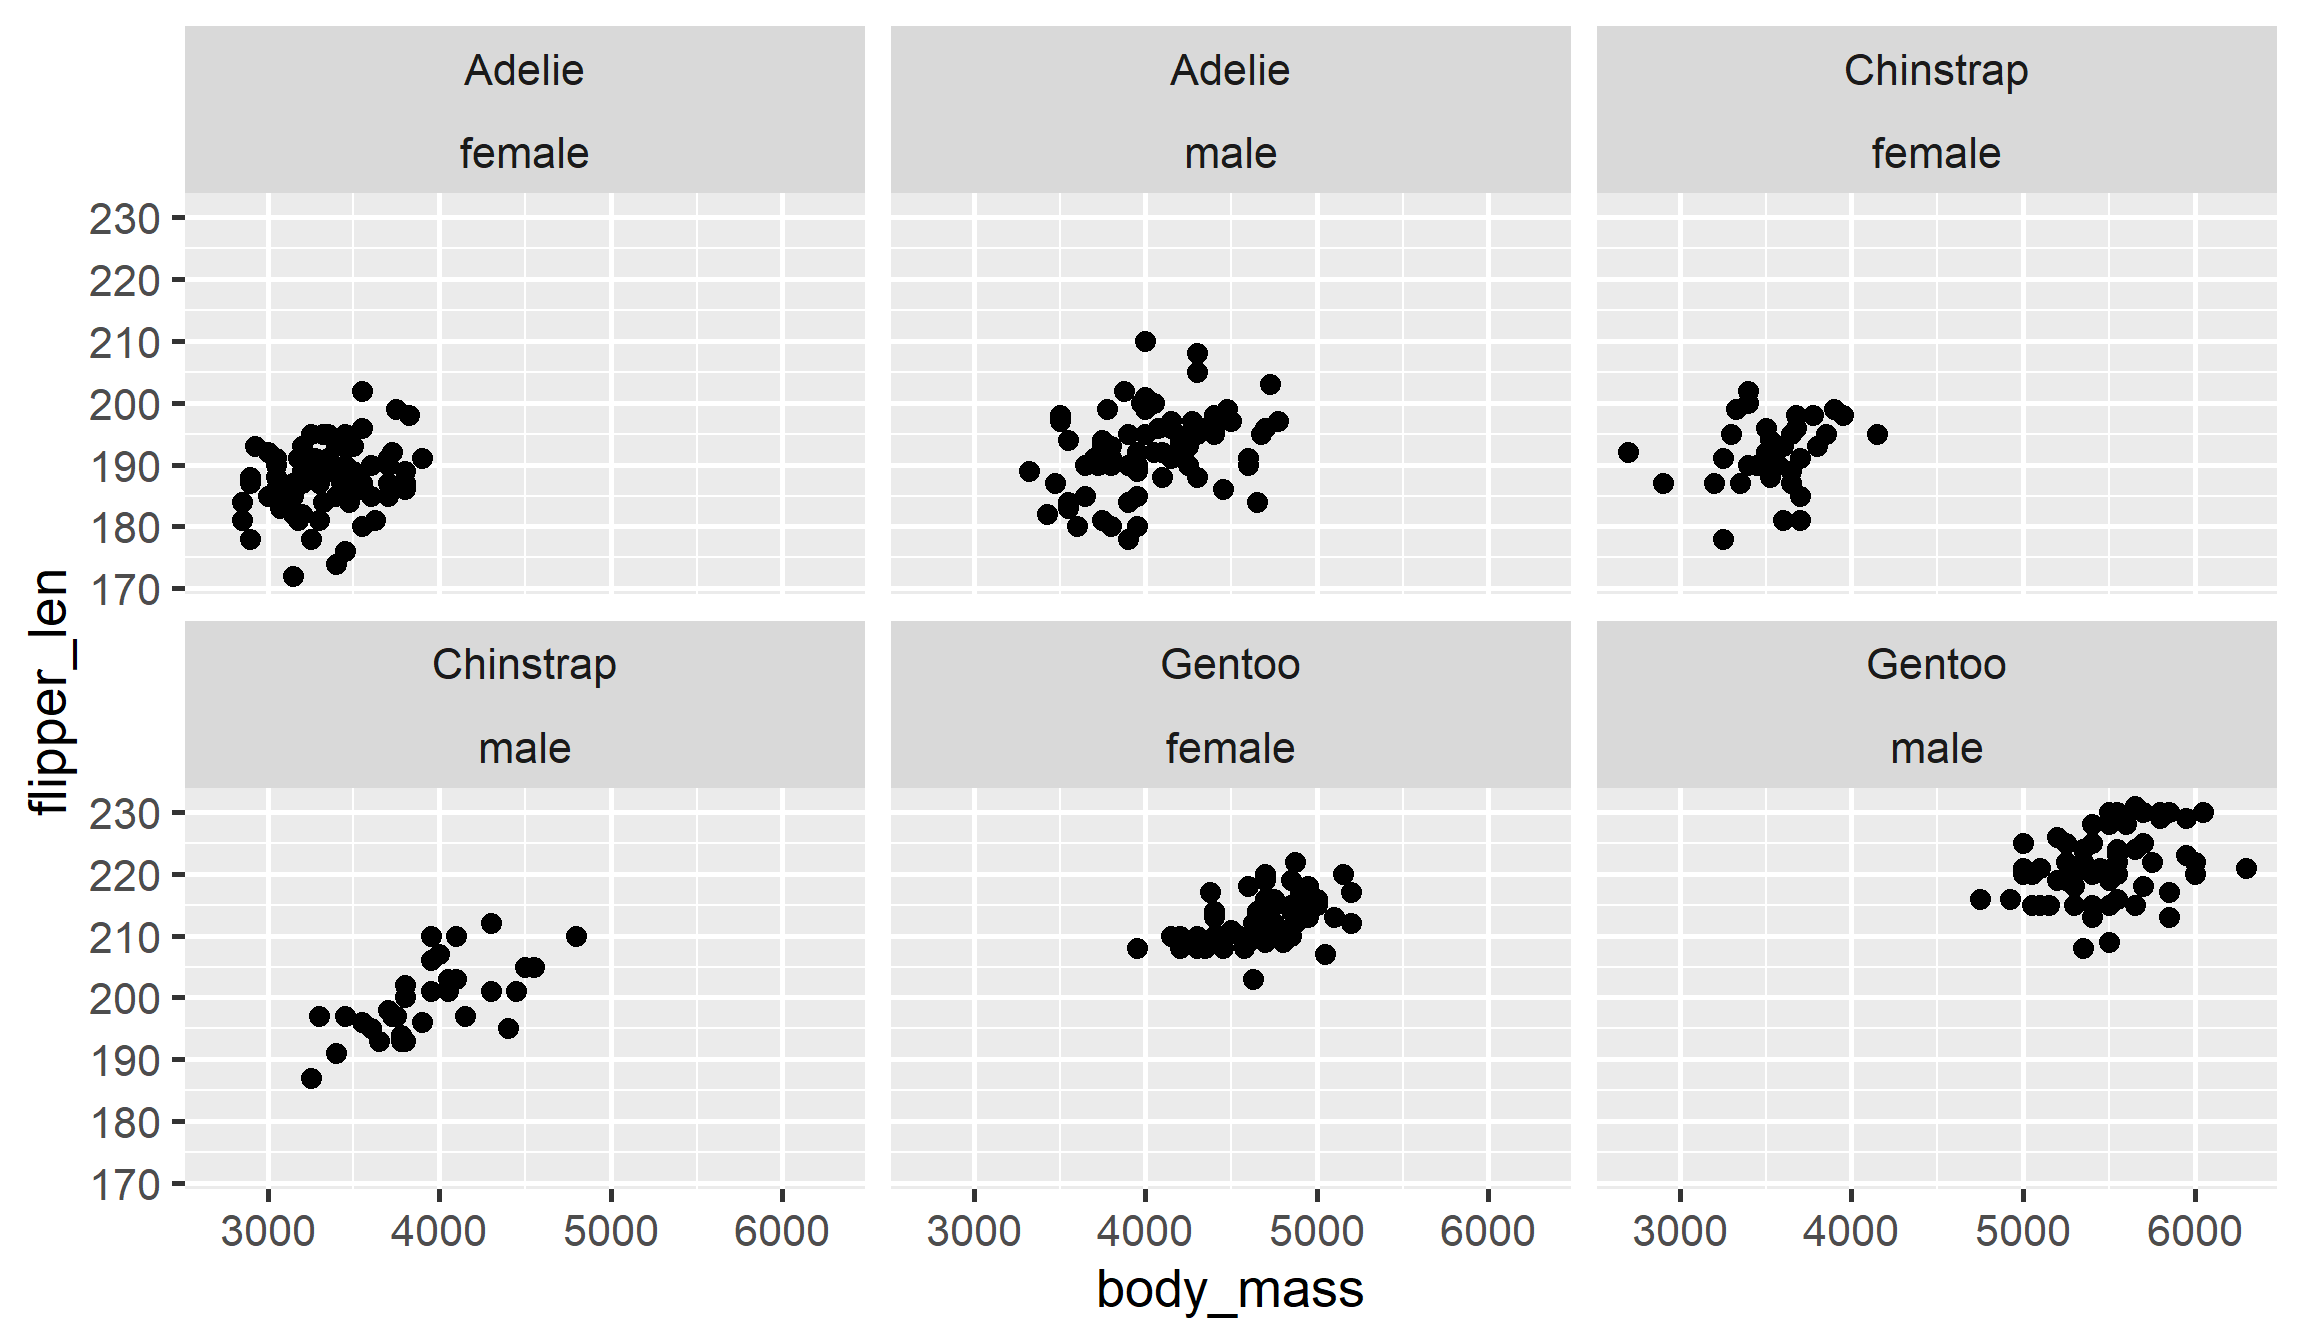
Freeing Scales
# While wrapping, give each *subplot* its own scales
p + facet_wrap(facets = vars(species, sex), scales = "free")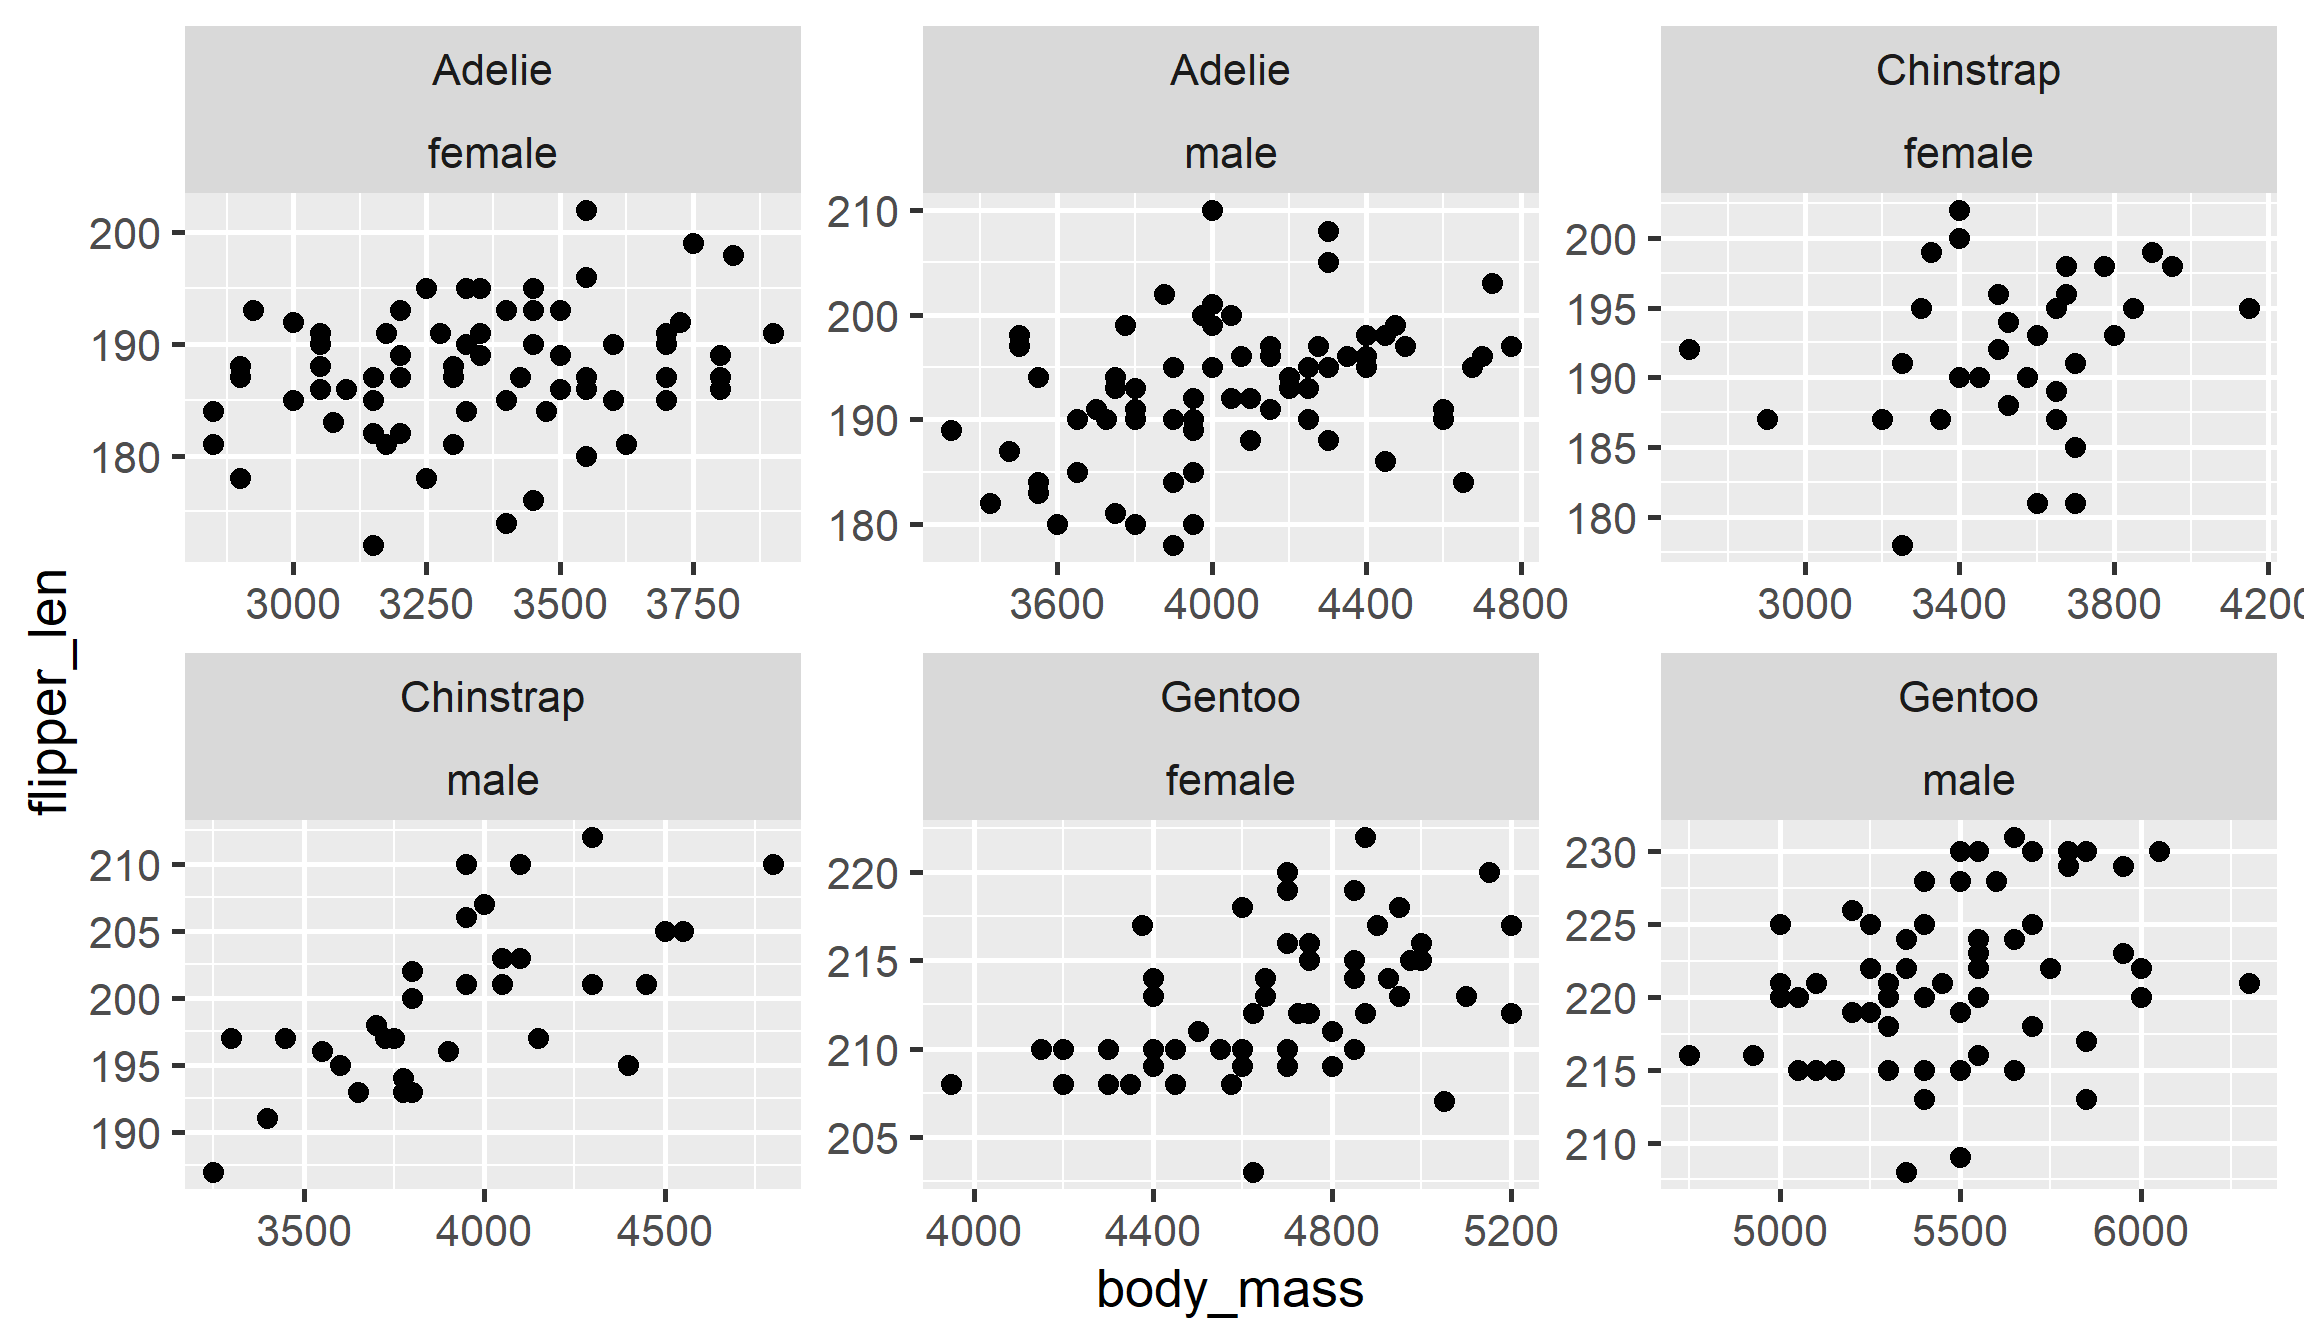
Facet Grid
# Create a sex-by-species matrix (or grid) of subplots
p + facet_grid(rows = vars(sex), cols = vars(species))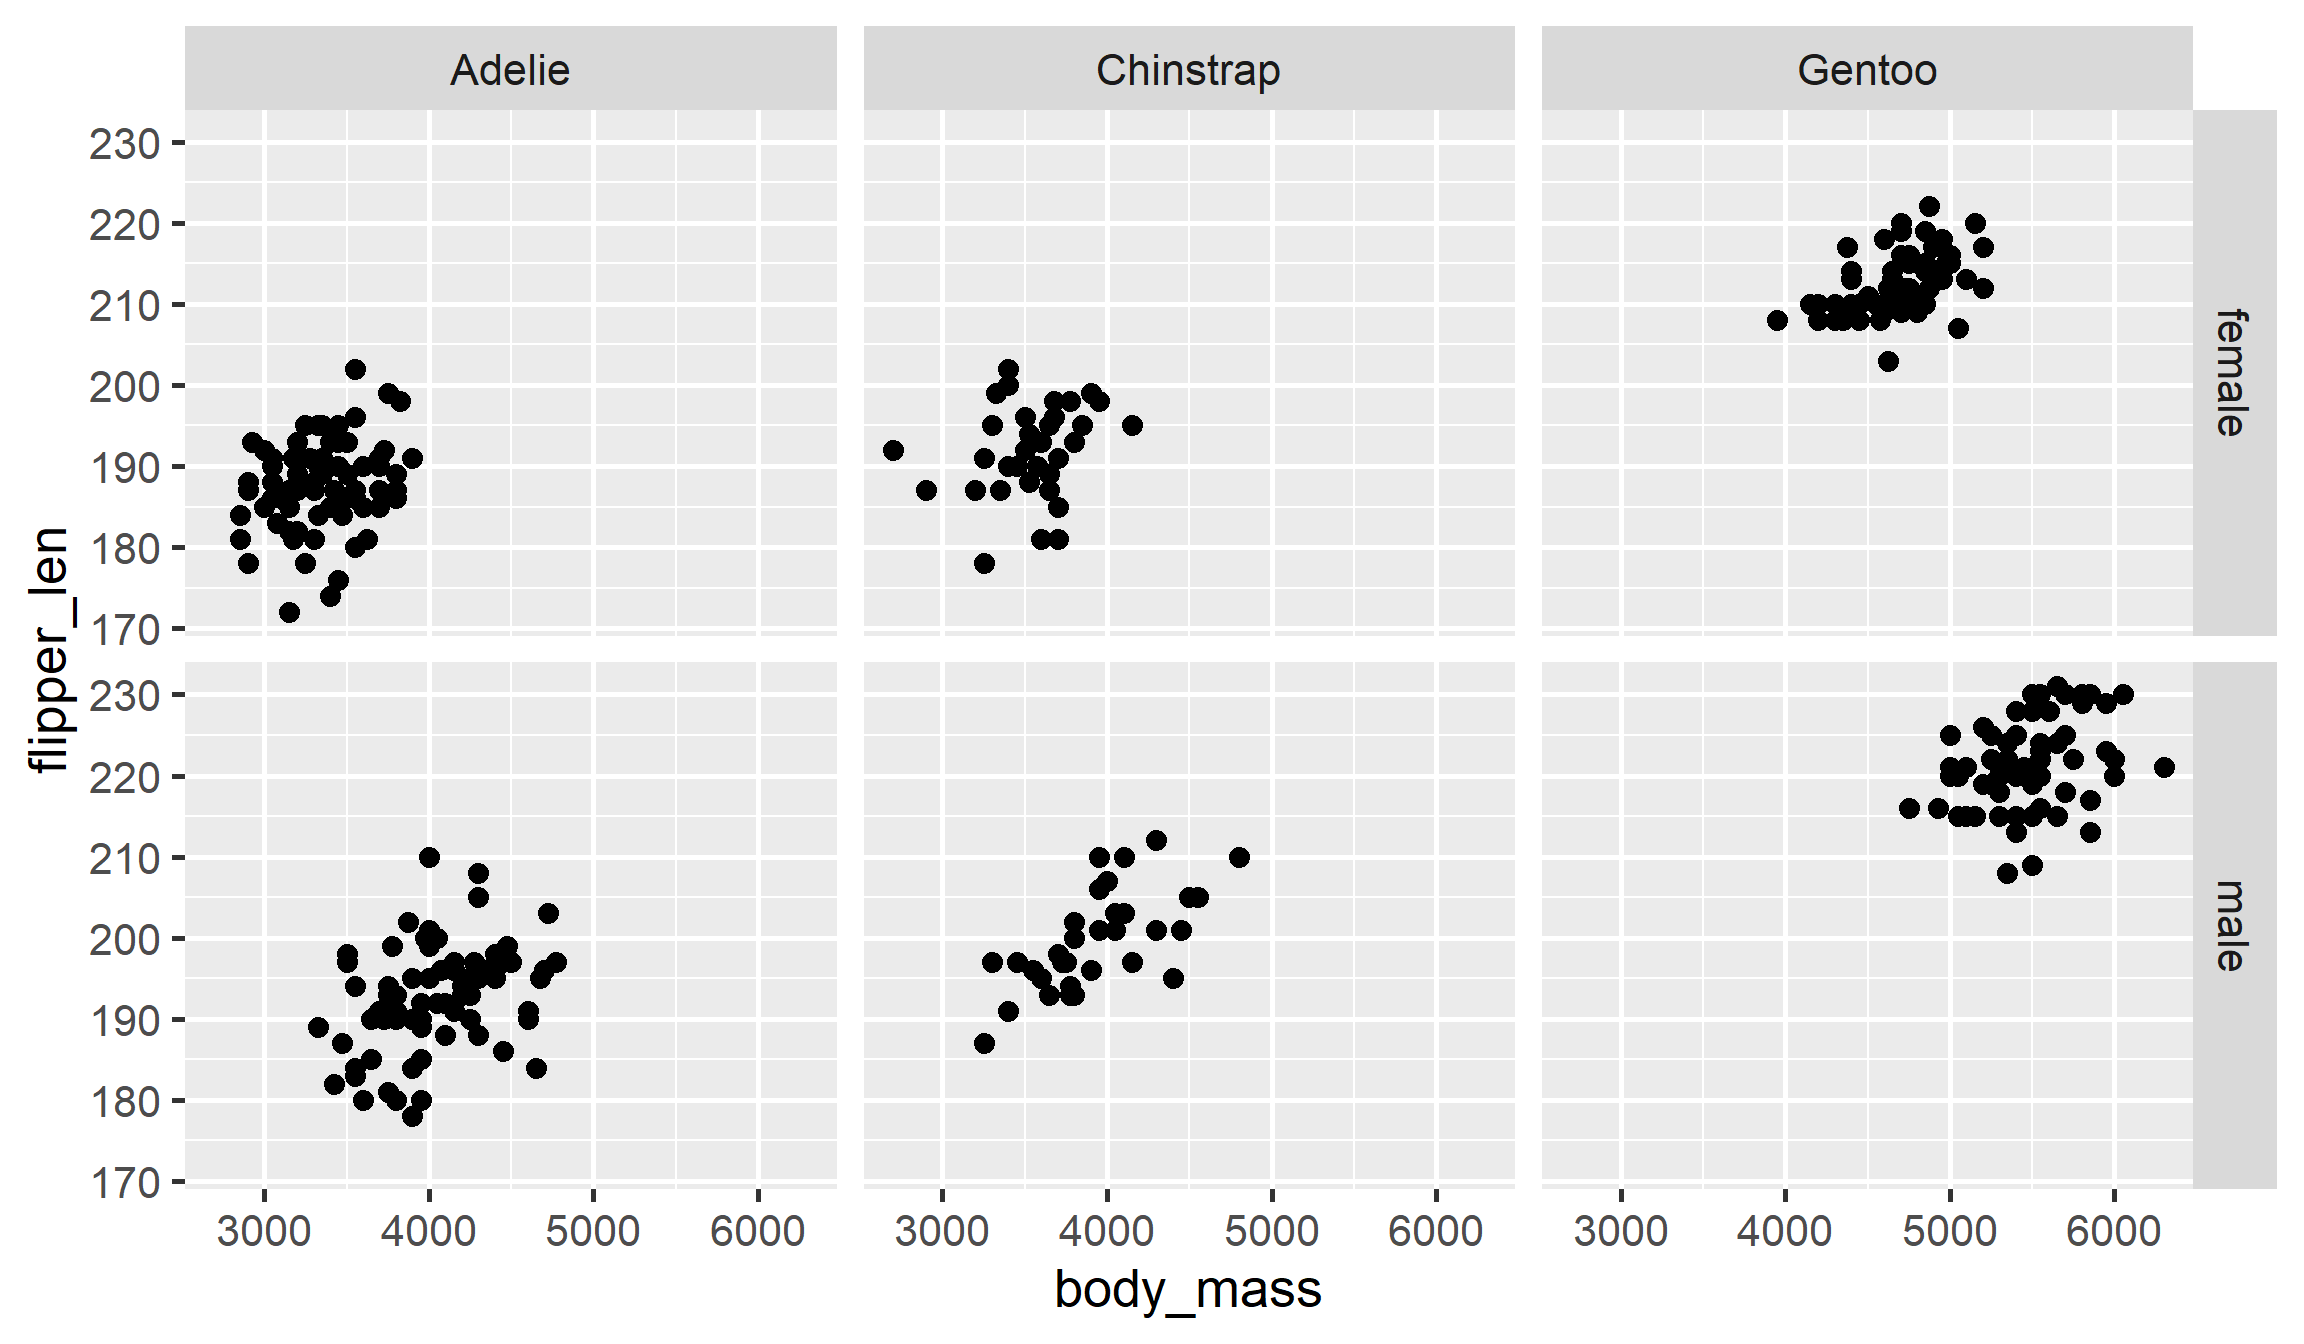
Facet Labellers
# Label each facet "strip" using both the variable name and value
p + facet_grid(rows = vars(sex), cols = vars(species), labeller = label_both)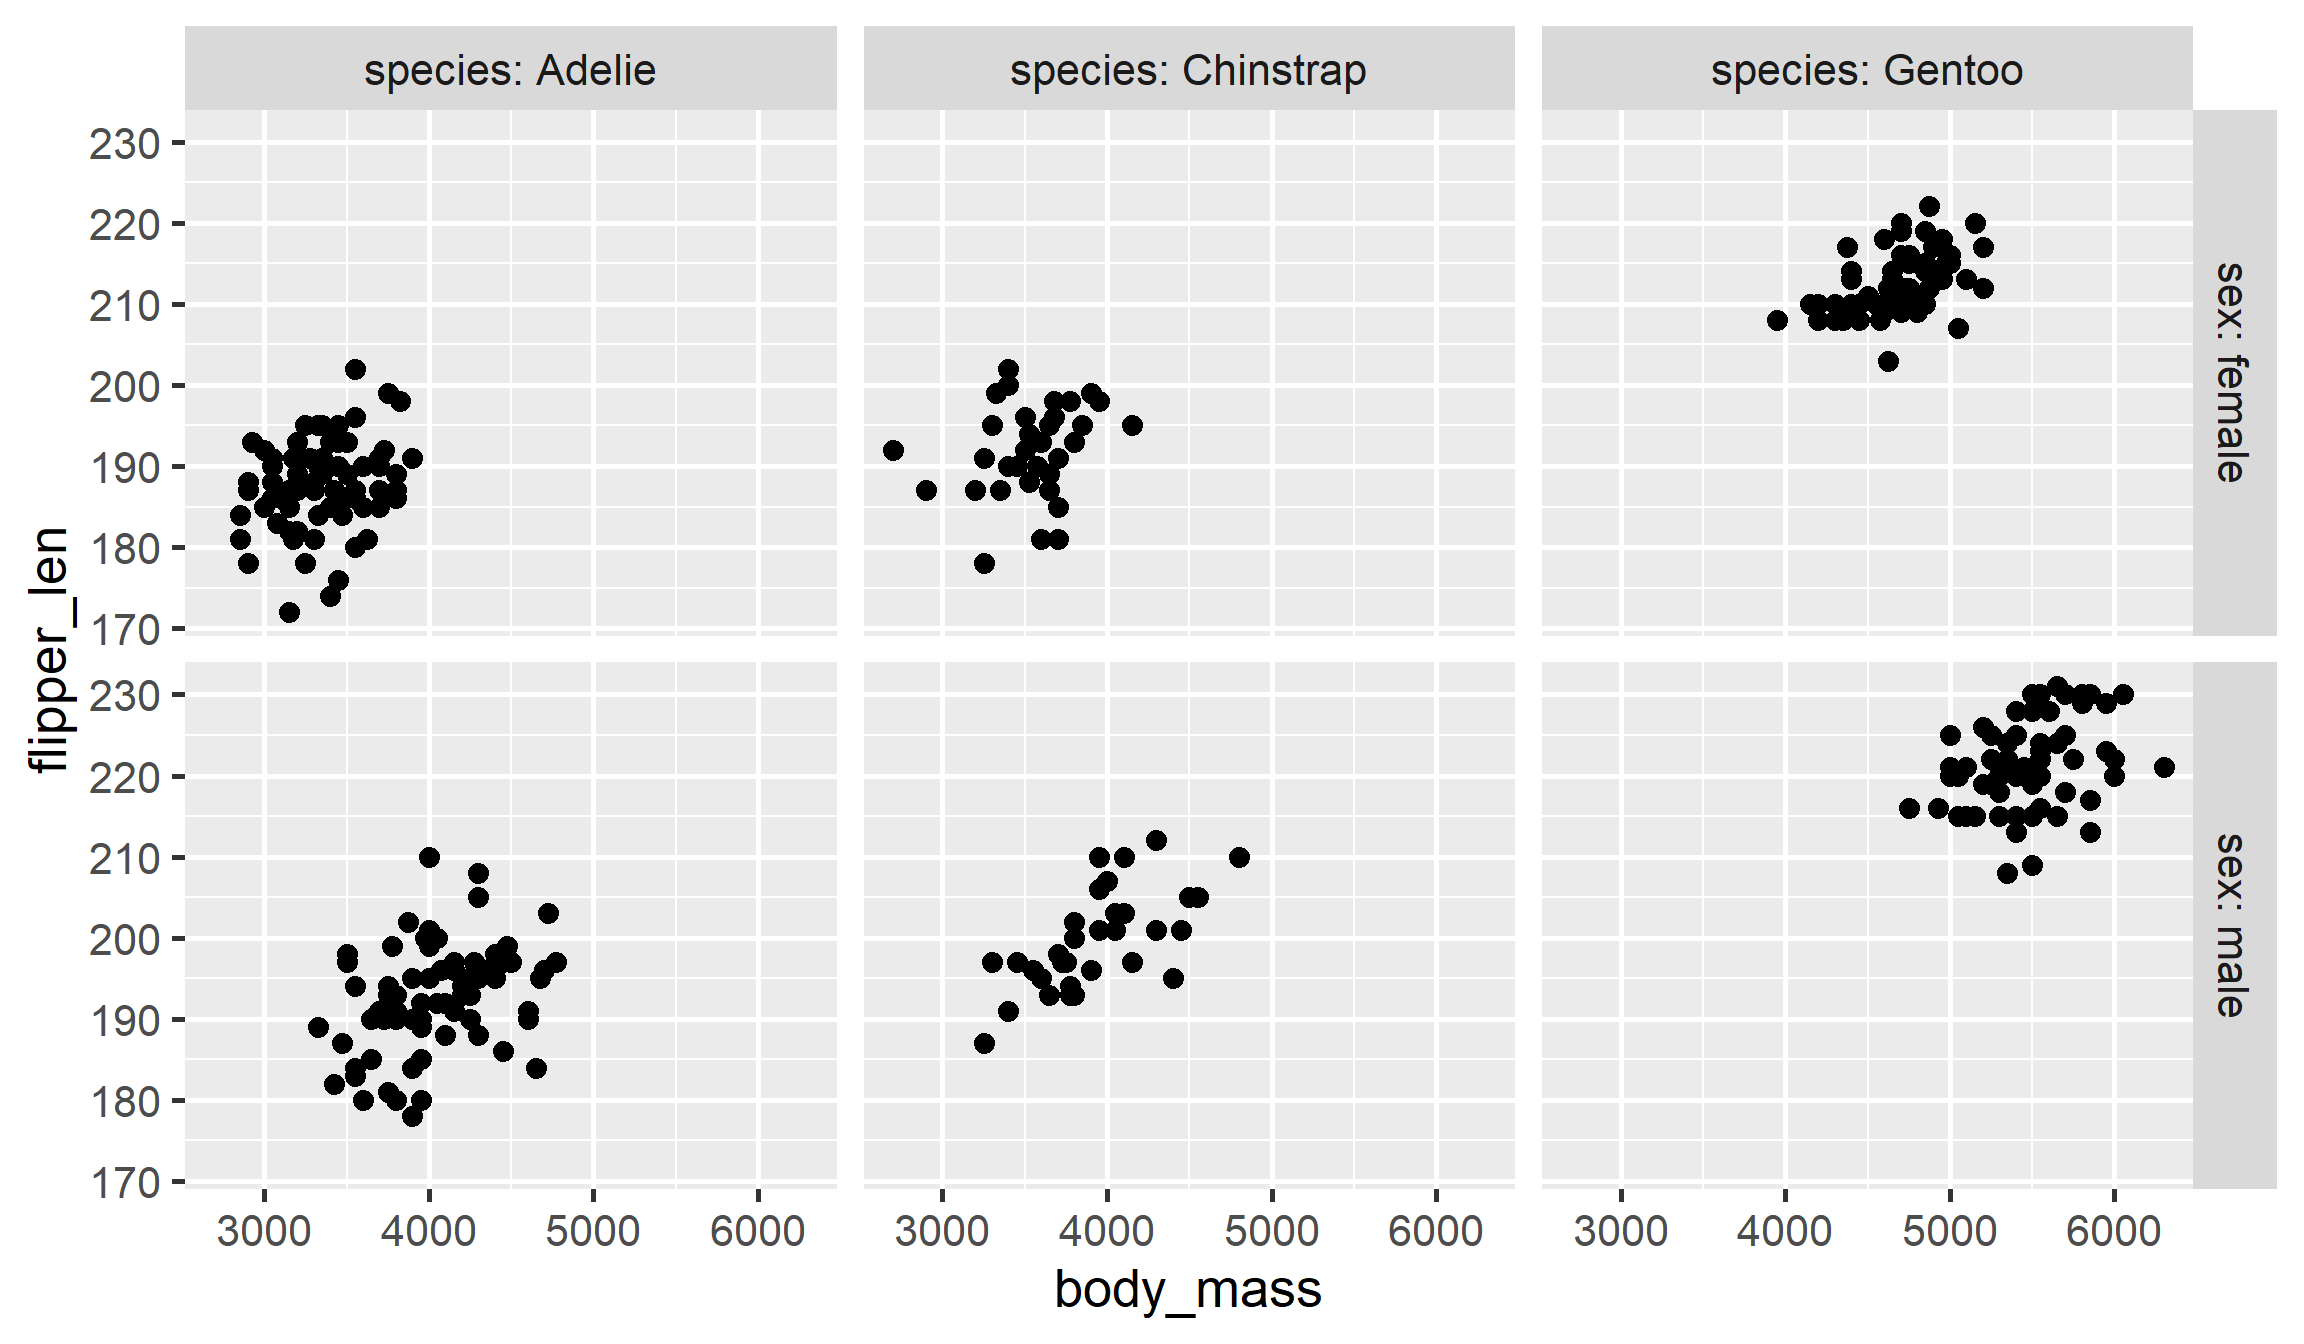
Freeing Scales
# While gridding, give each *row* and each *column* its own scales
p + facet_grid(rows = vars(sex), cols = vars(species), scales = "free")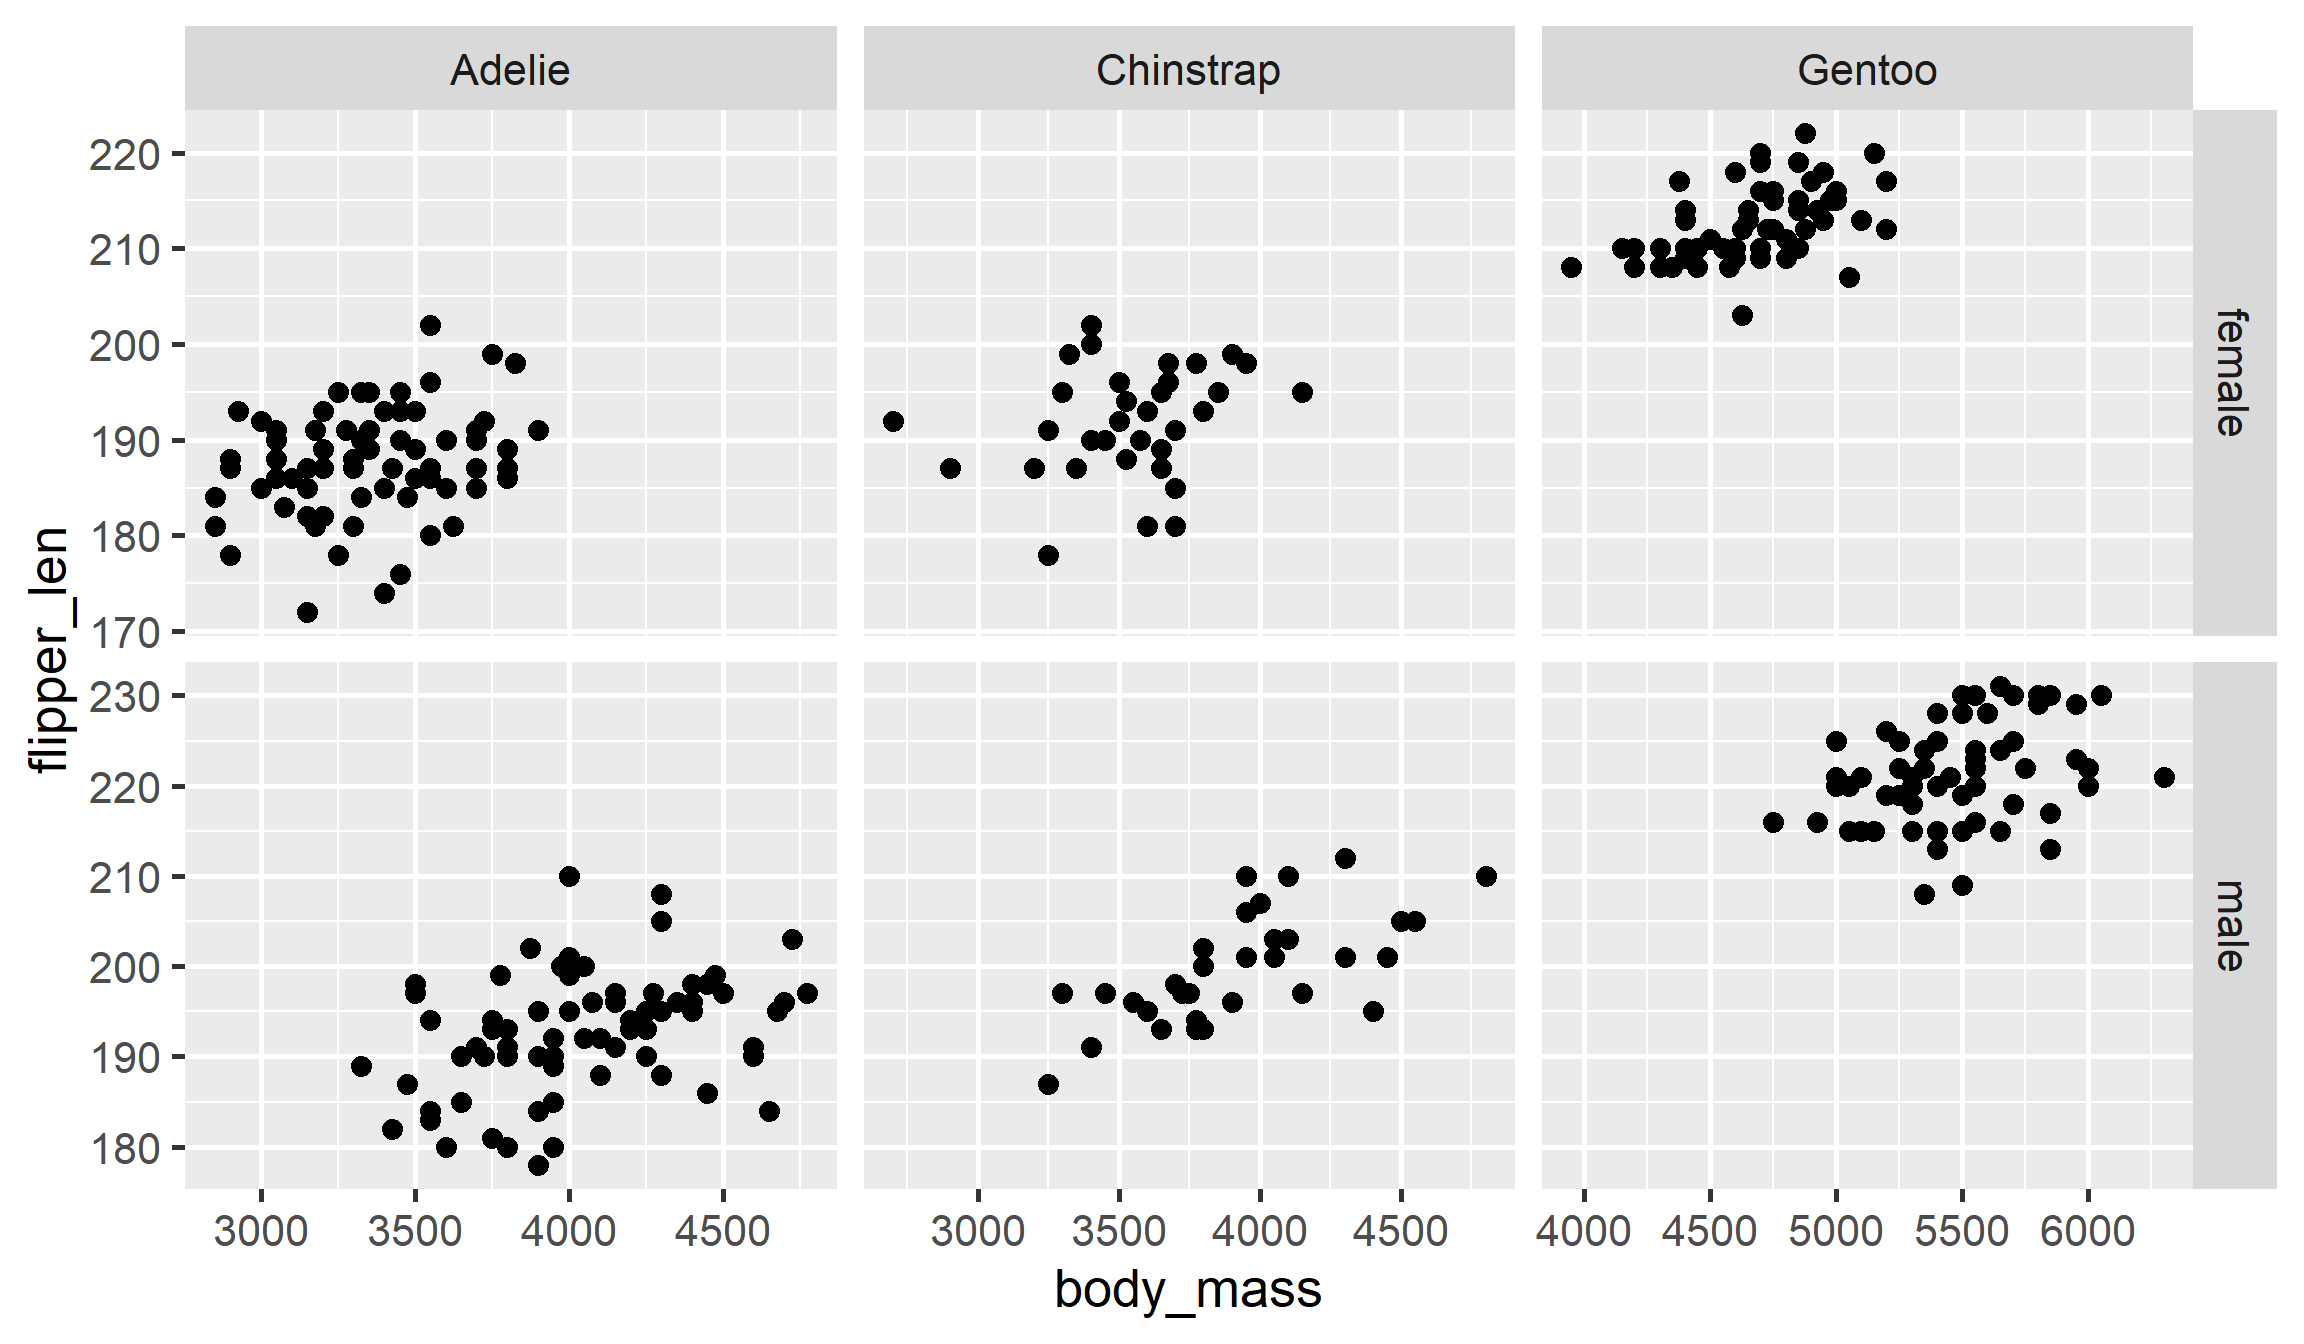
The Stacking Default
# The default for geom_bar is `position = "stack"`
ggplot(penguins2, aes(x = species, fill = island)) + geom_bar(color = "black")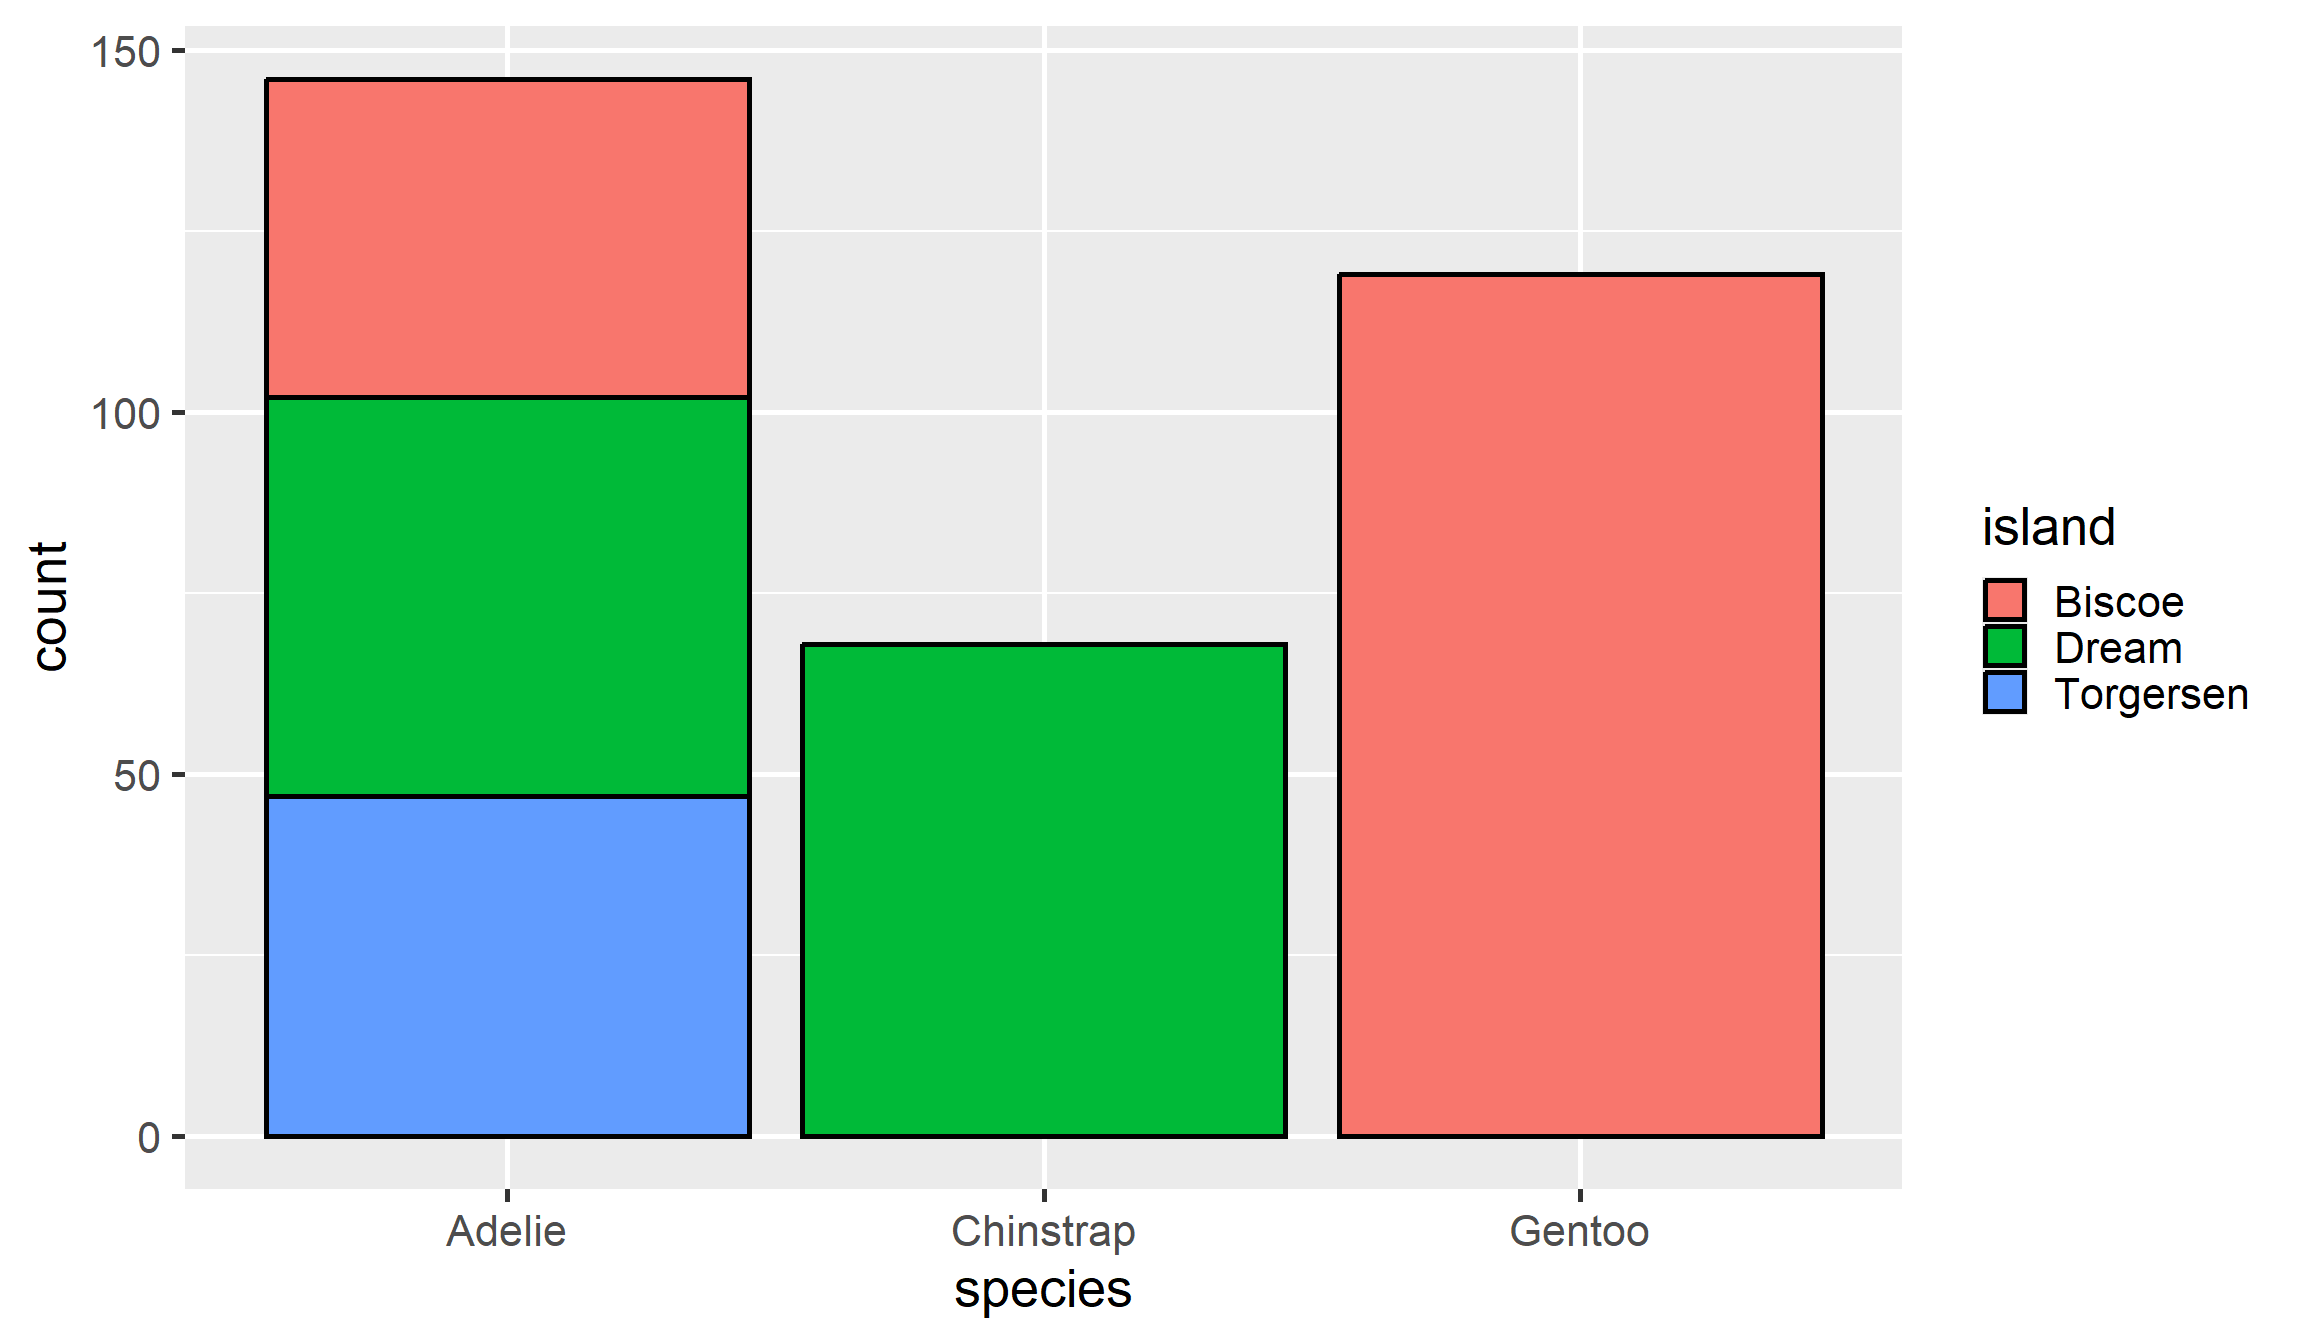
Proportional Bars
# We can use `position = "fill"` to turn them into proportions
ggplot(penguins, aes(x = species, fill = island)) +
  geom_bar(color = "black", position = "fill") + labs(y = "proportion")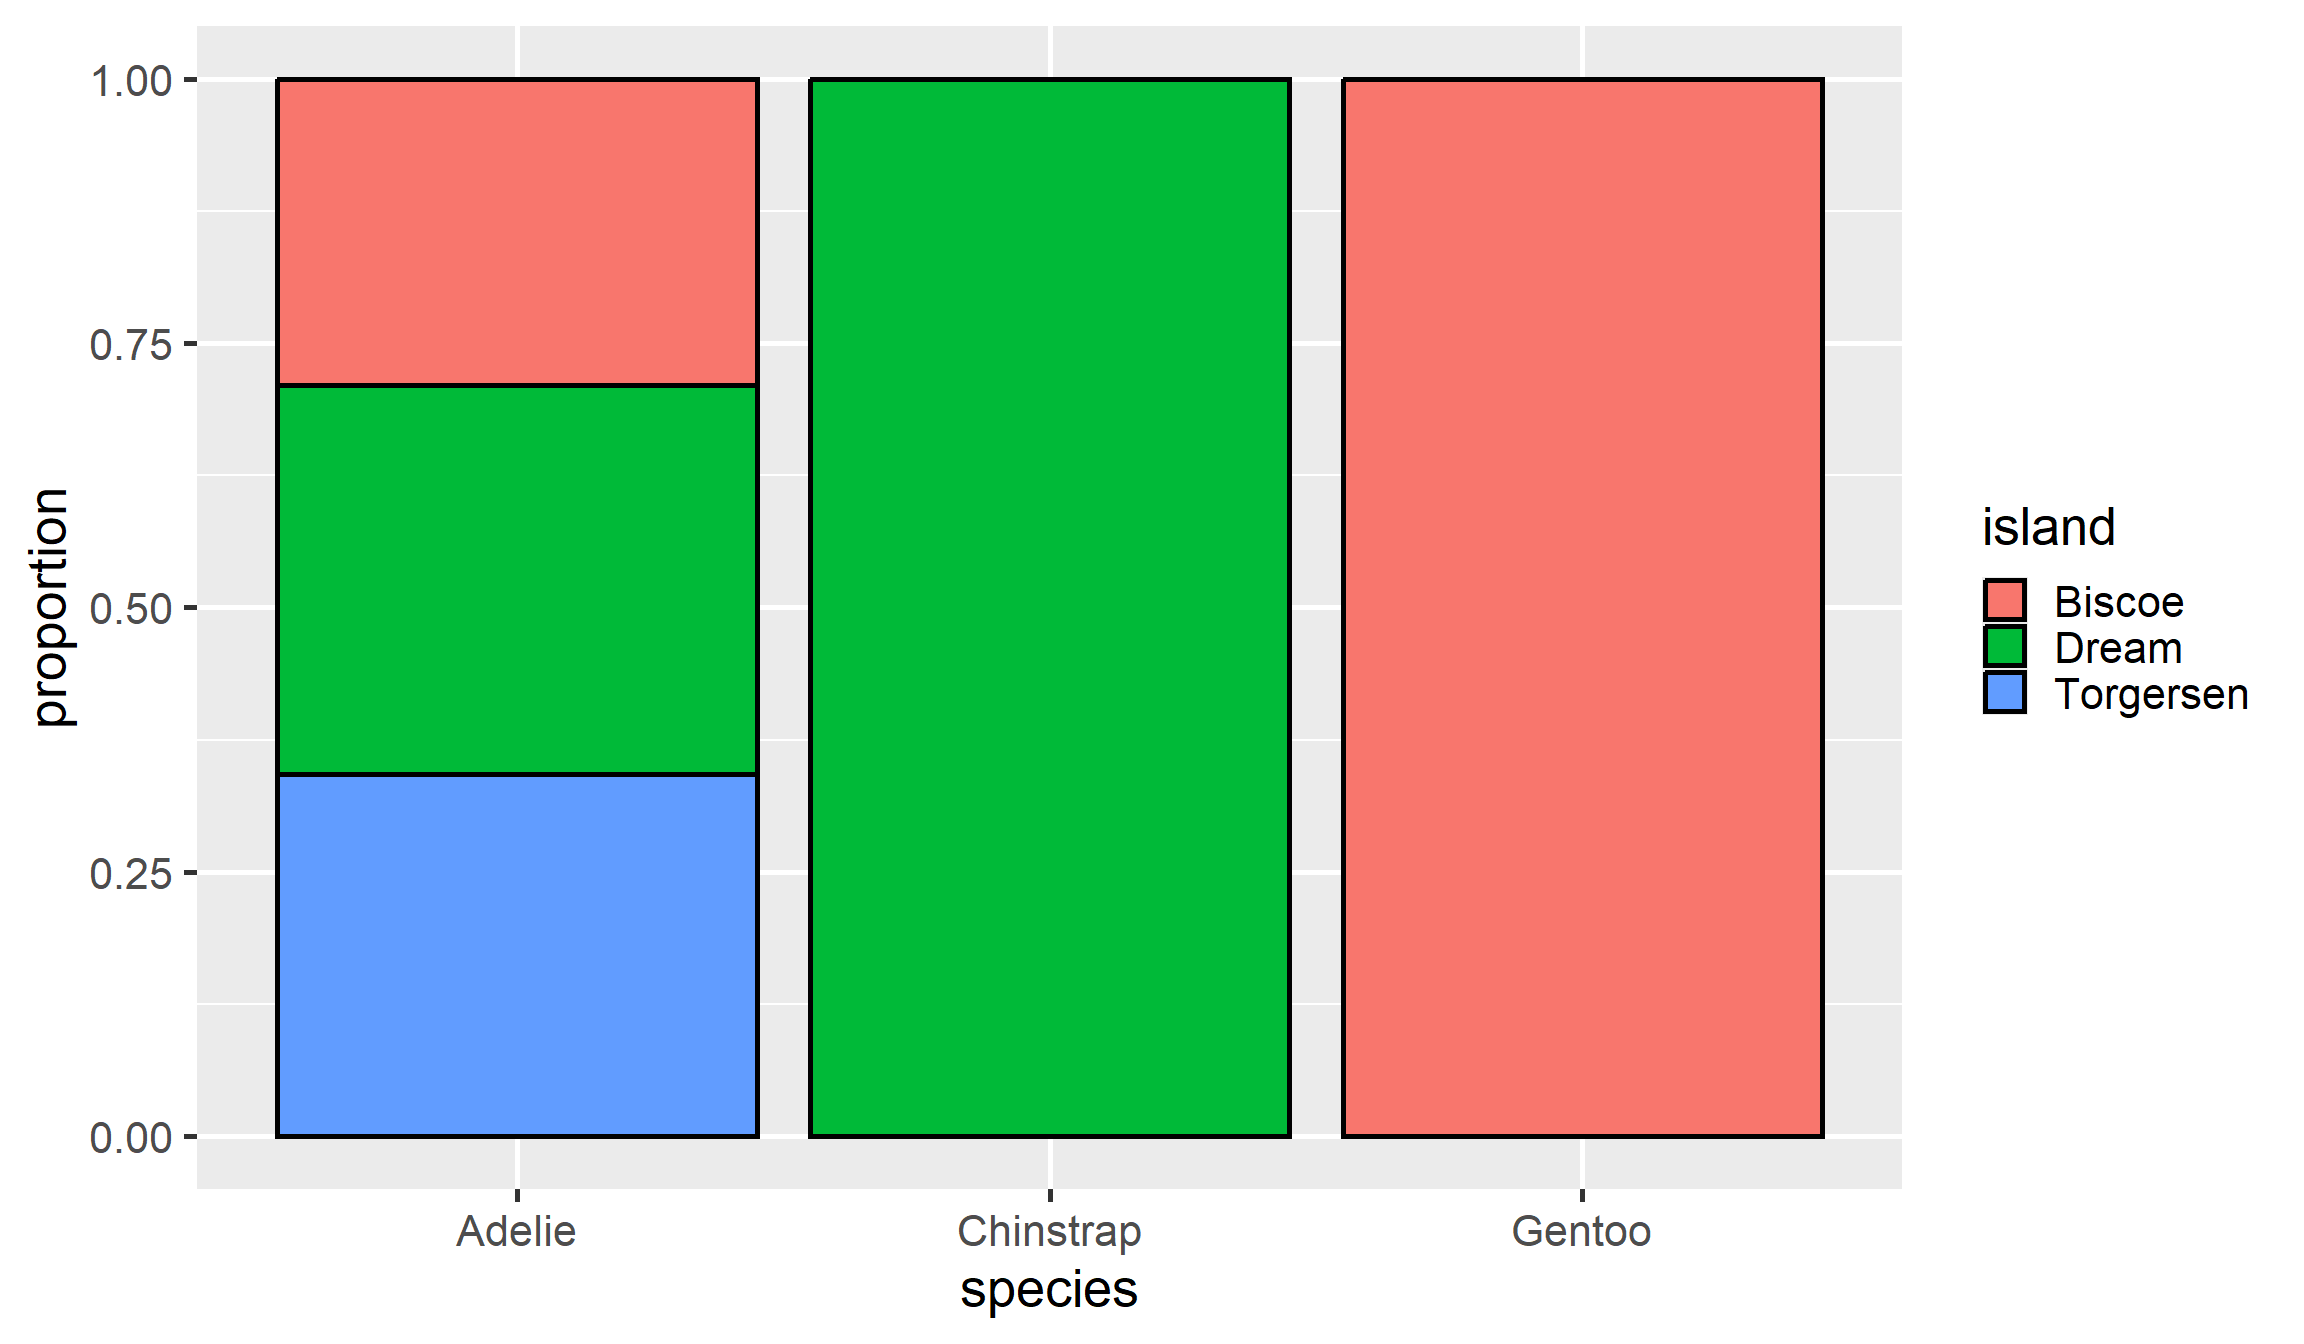
Dodging Bars
# We can use `position = "dodge"` to put them side-by-side
ggplot(penguins, aes(x = species, fill = island)) +
  geom_bar(color = "black", position = "dodge")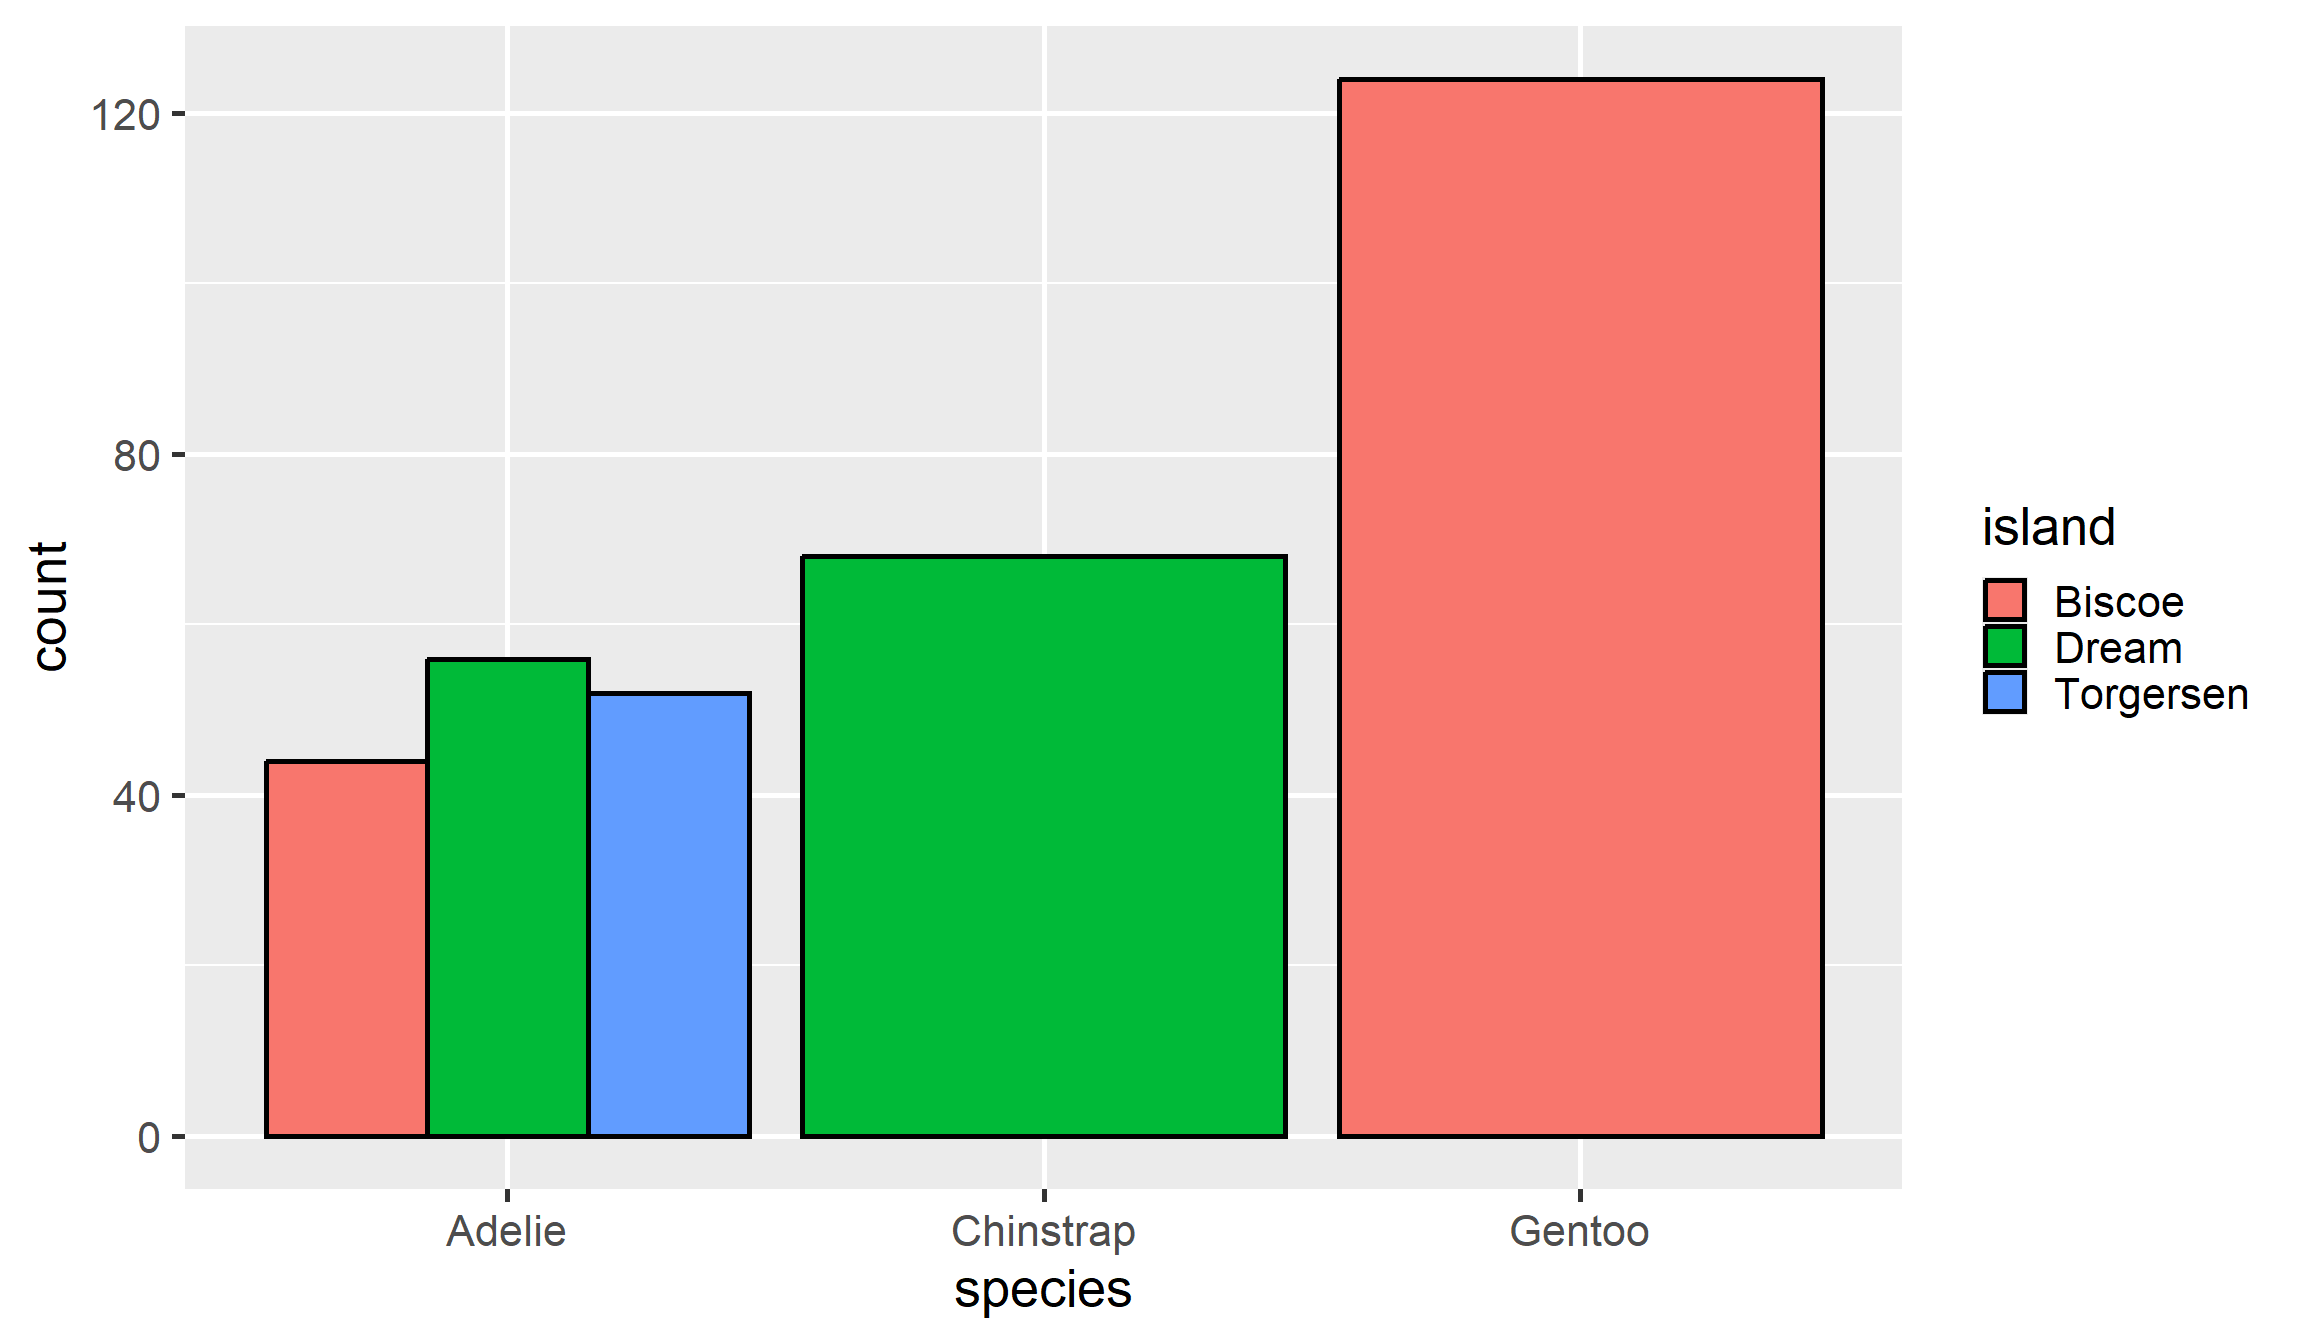
Dodging Columns
# Now we map the y-axis to `n` and use geom_col()
ggplot(penguins_sum, aes(x = species, y = n, fill = island)) +
  geom_col(color = "black", position = "dodge")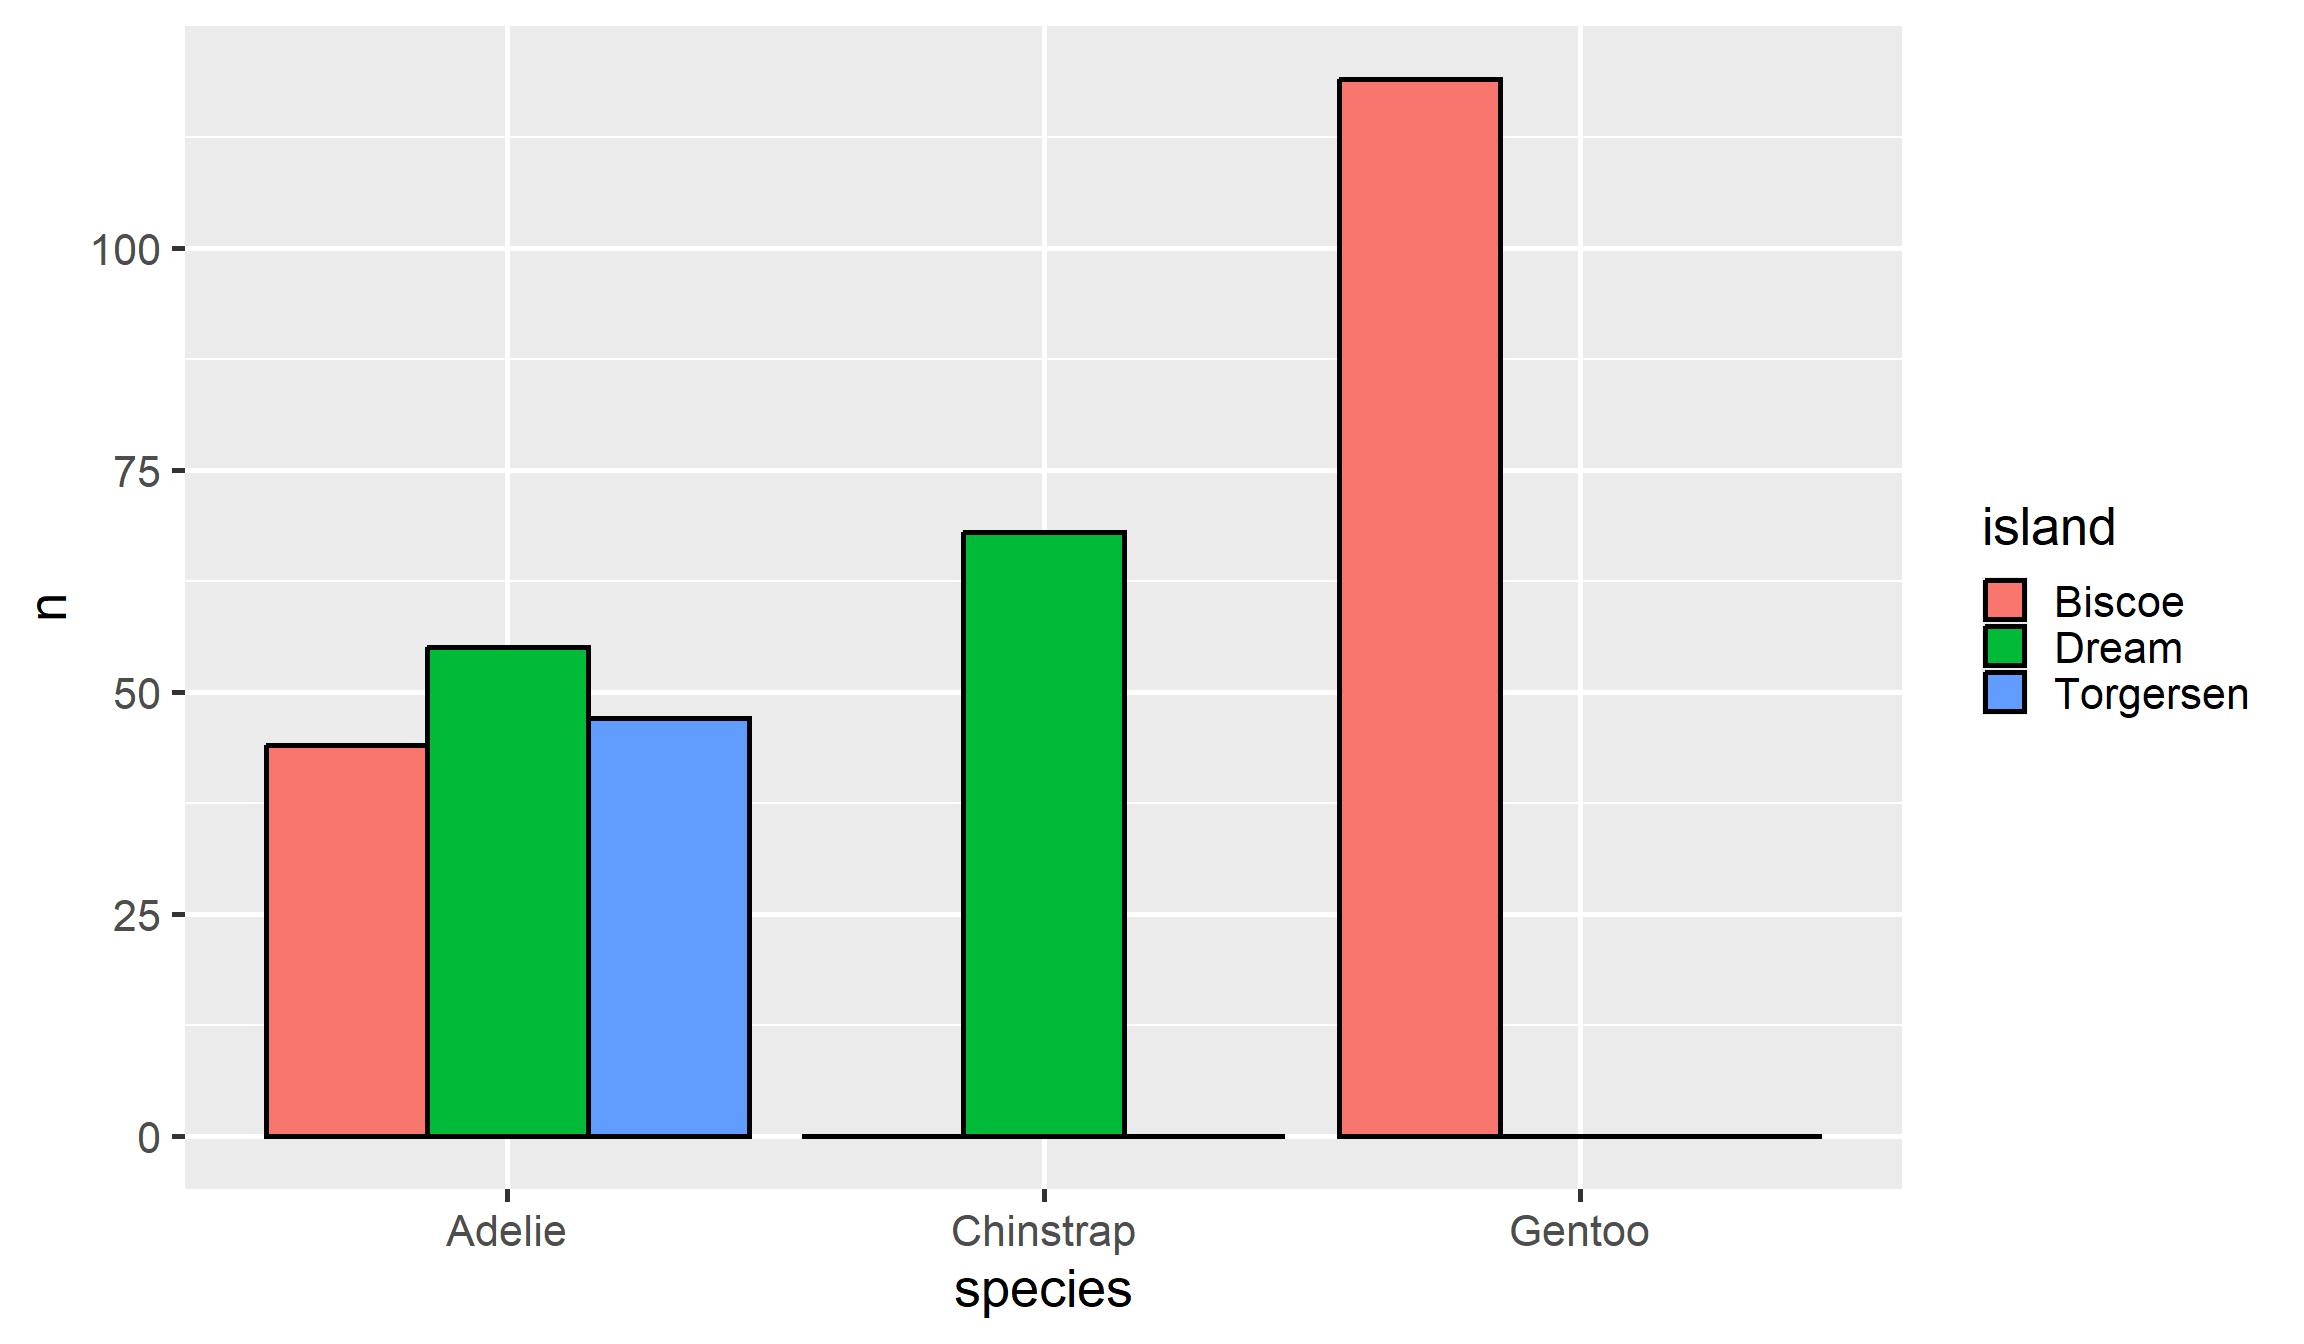
Overplotting
# Multiple overlapping geoms can lead to "overplotting"
data("mpg", package = "ggplot2")
ggplot(mpg, aes(x = displ, y = hwy)) + geom_point(alpha = 0.5)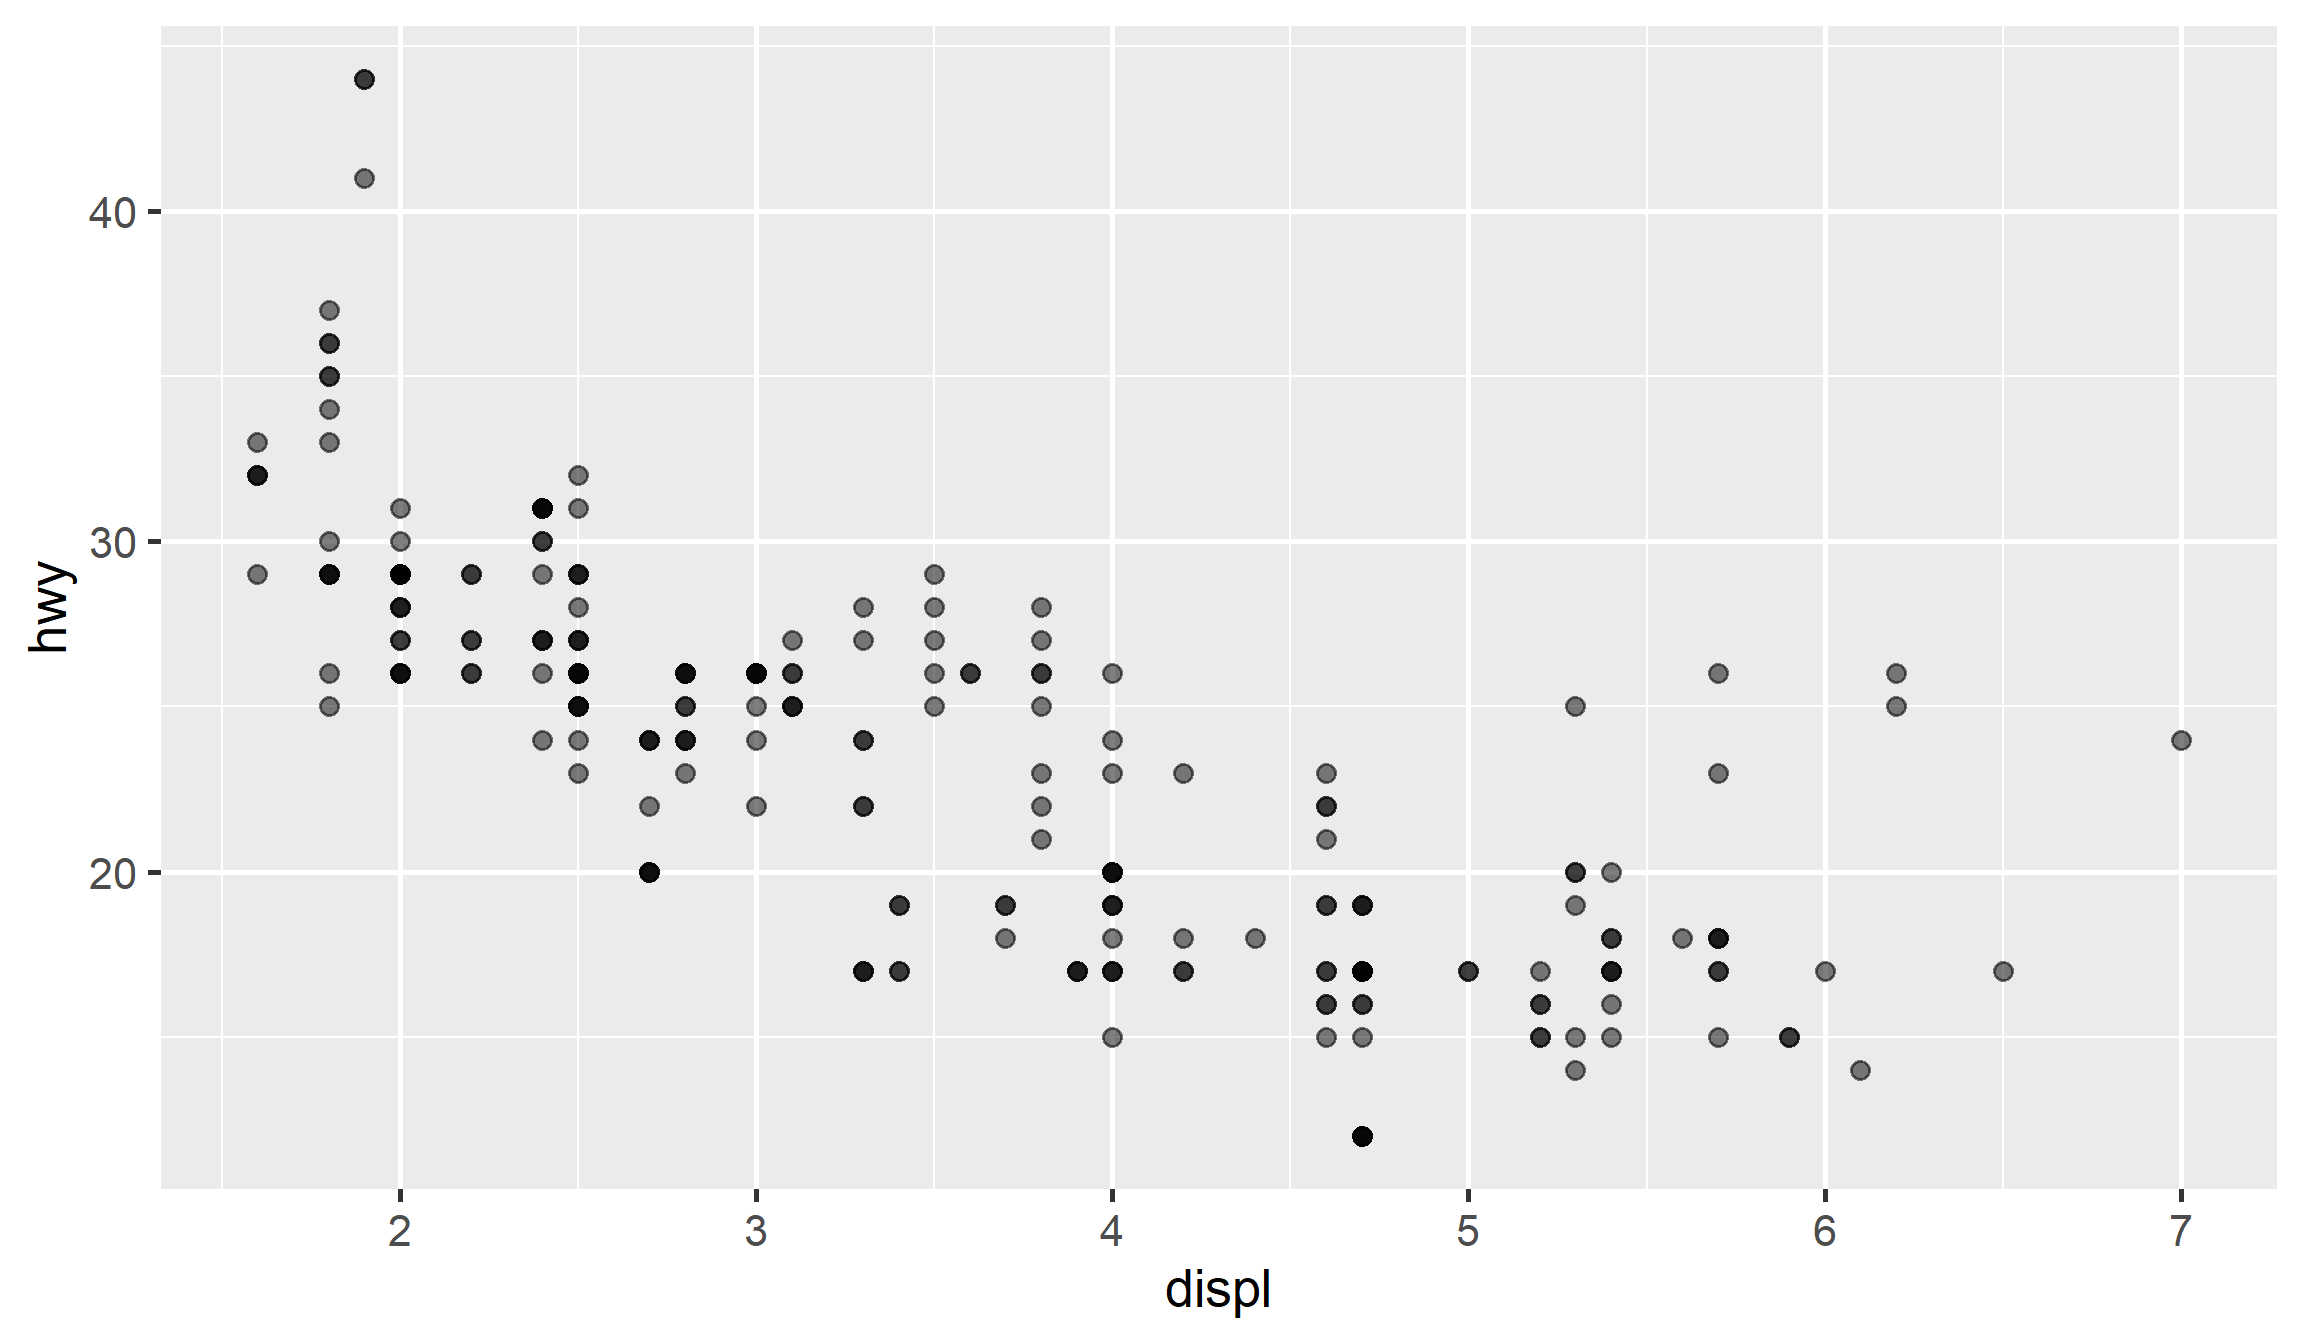
Jittering Points
# Jittering is pushing each point slightly in a random direction
ggplot(mpg, aes(x = displ, y = hwy)) +
  geom_point(alpha = 0.5, position = "jitter")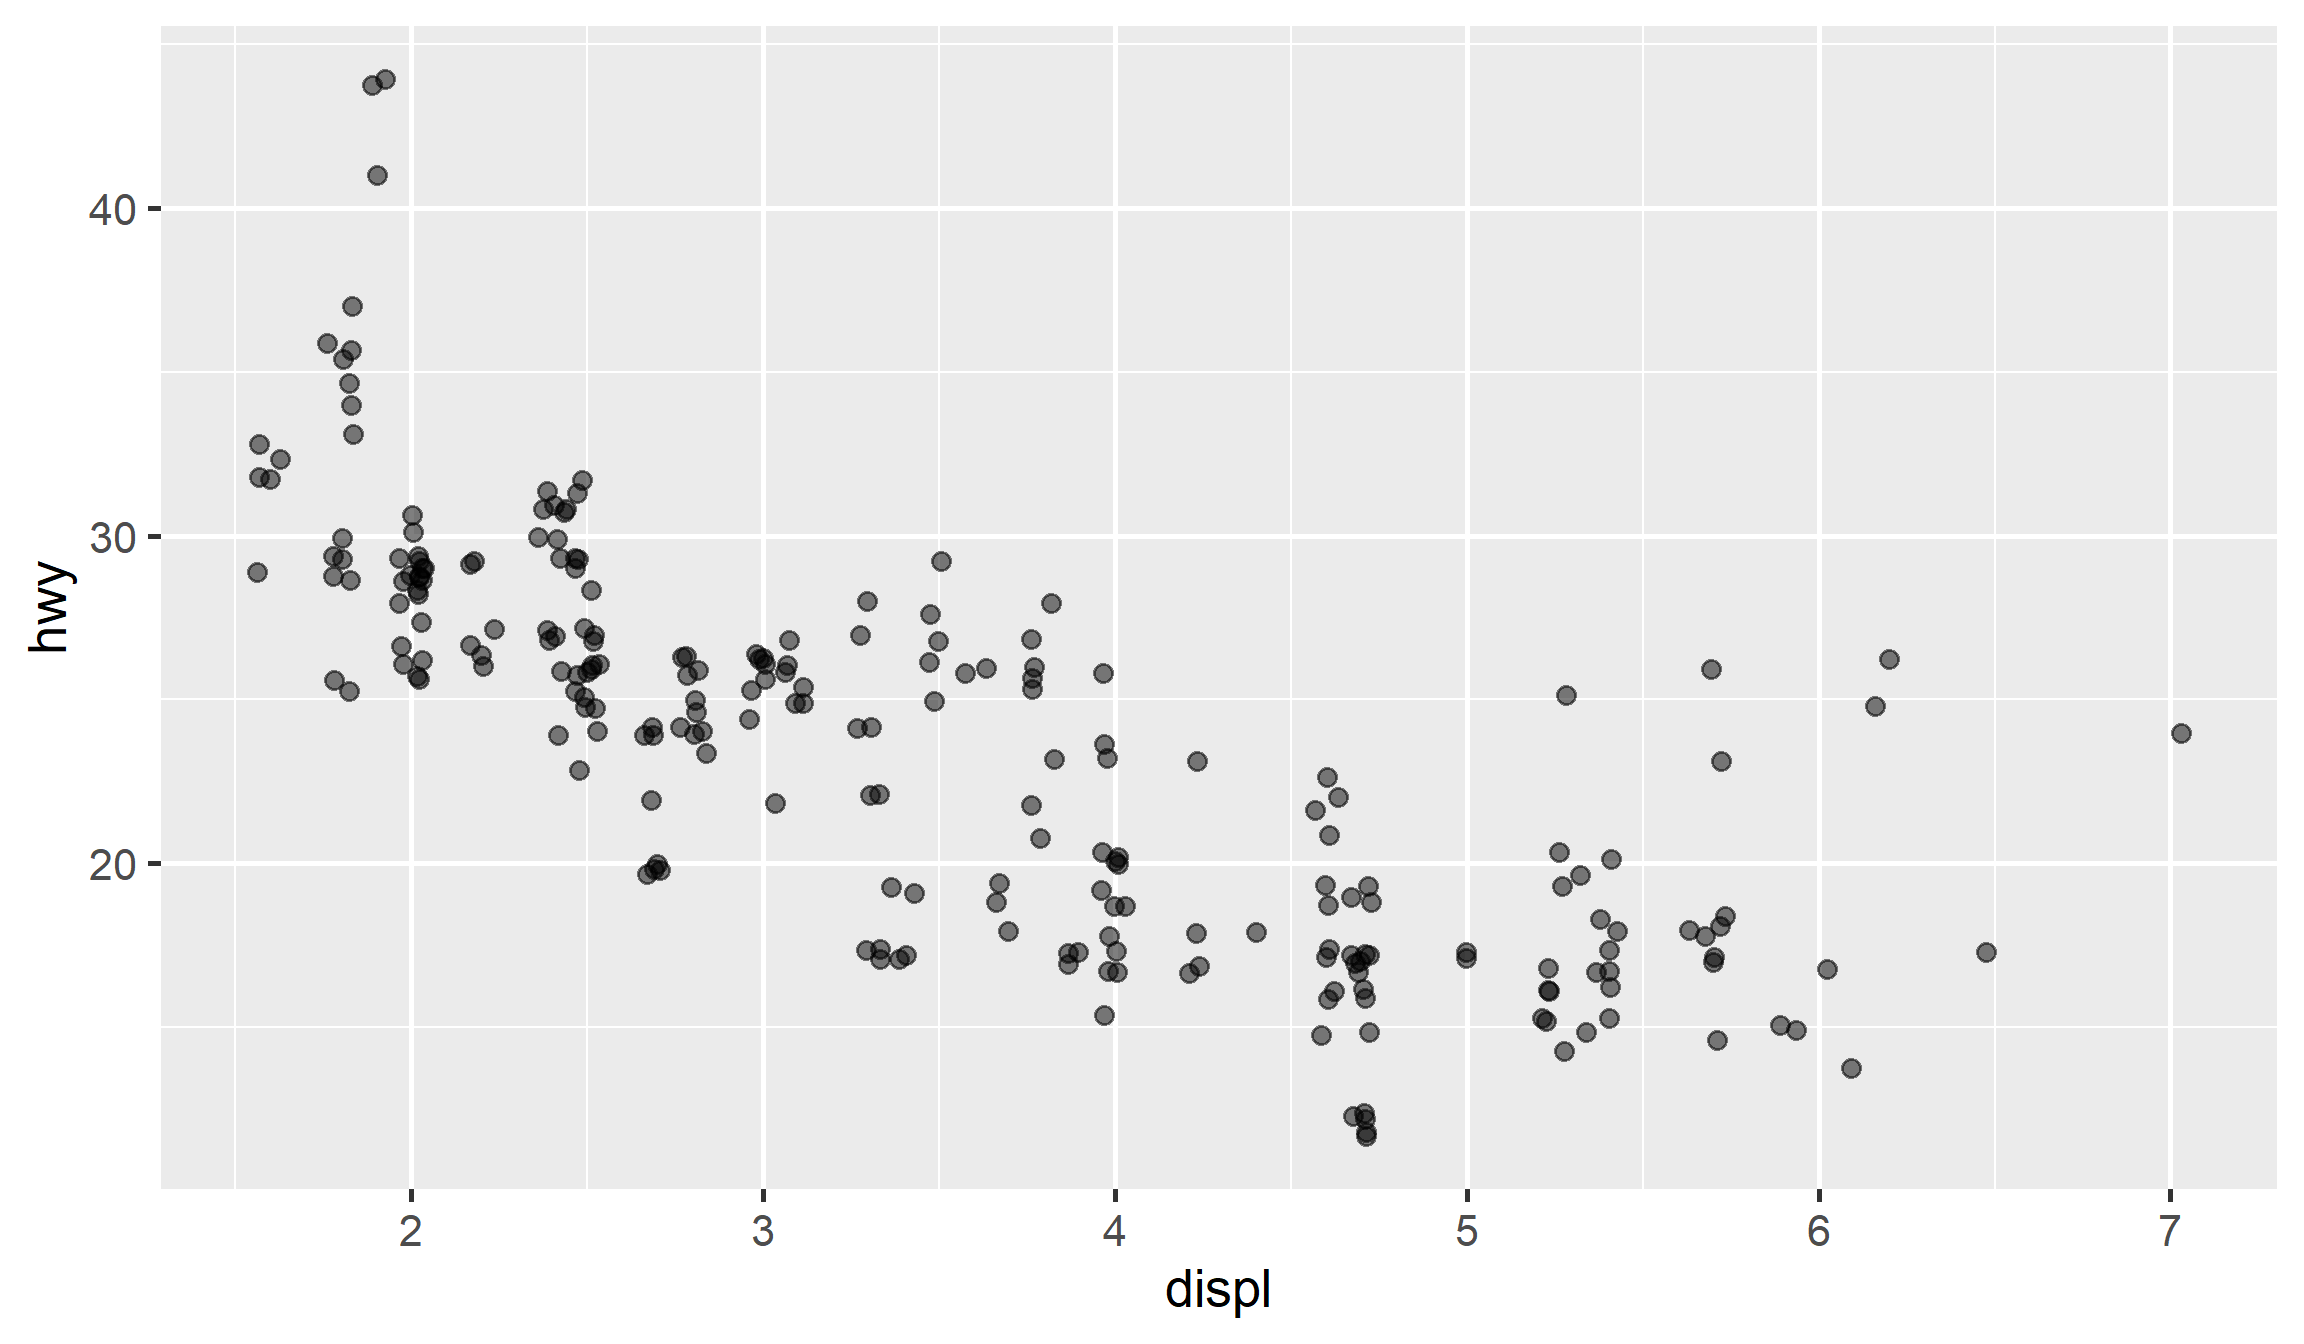
Jitter Magnitude
# We can push farther but pushing too far may become misleading
ggplot(mpg, aes(x = displ, y = hwy)) +
  geom_point(alpha = 0.5, position = position_jitter(width = .5, height = .5))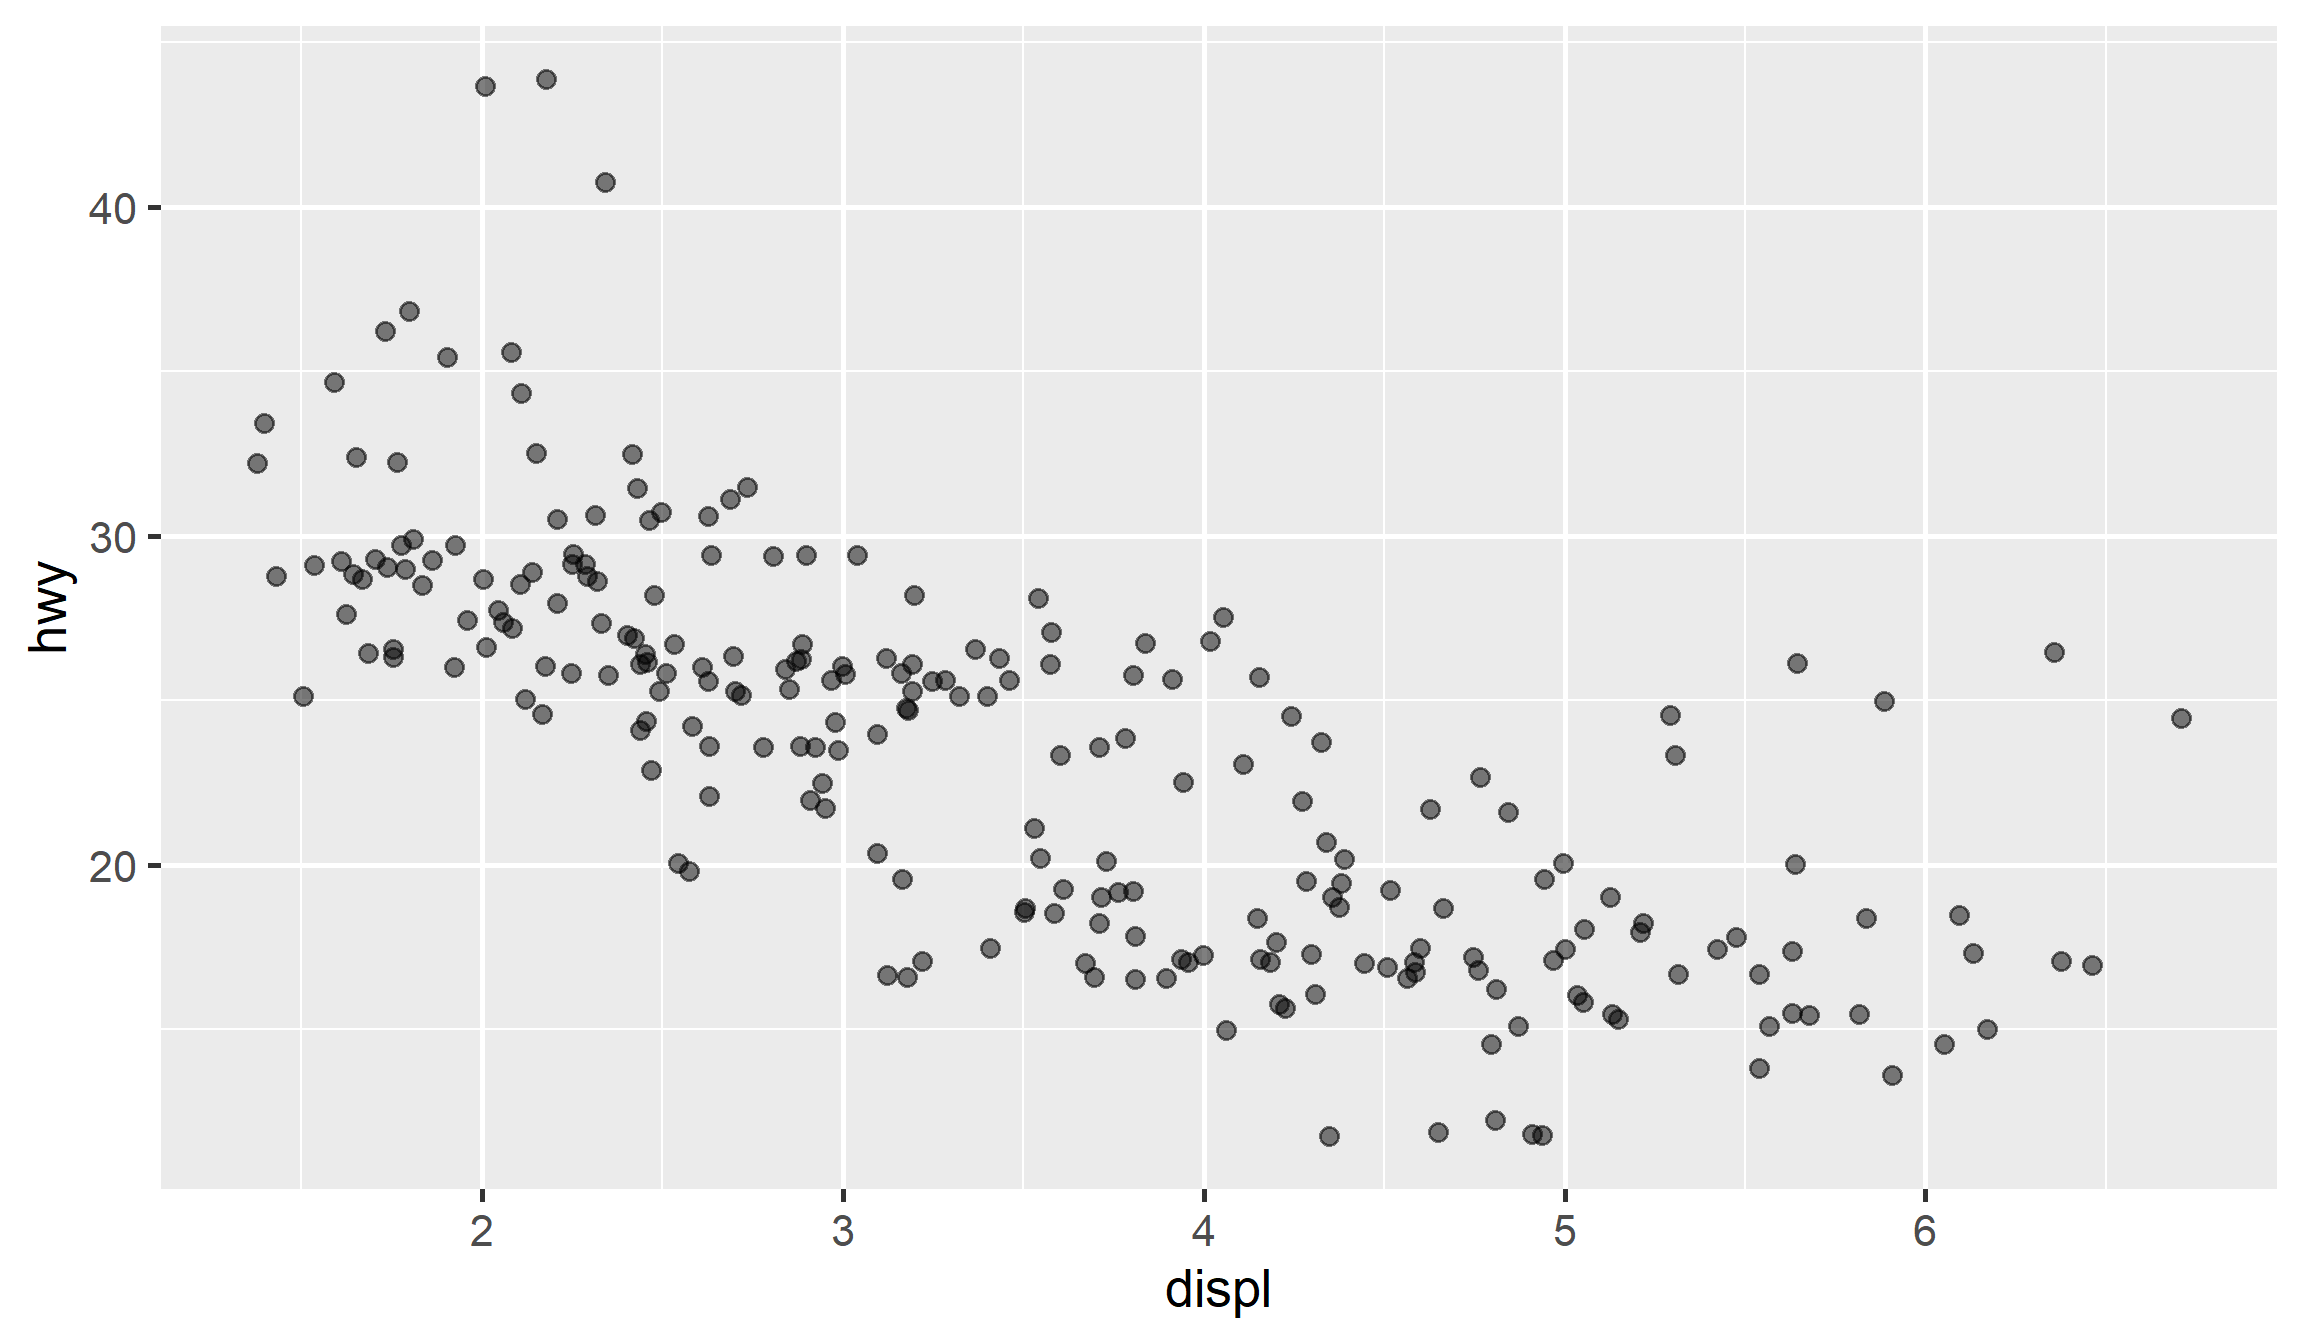
Extreme Overplotting
# With lots and lots of points, jittering is unlikely to help
data("diamonds", package = "ggplot2")
ggplot(diamonds, aes(x = carat, y = price)) + geom_point(alpha = 0.5)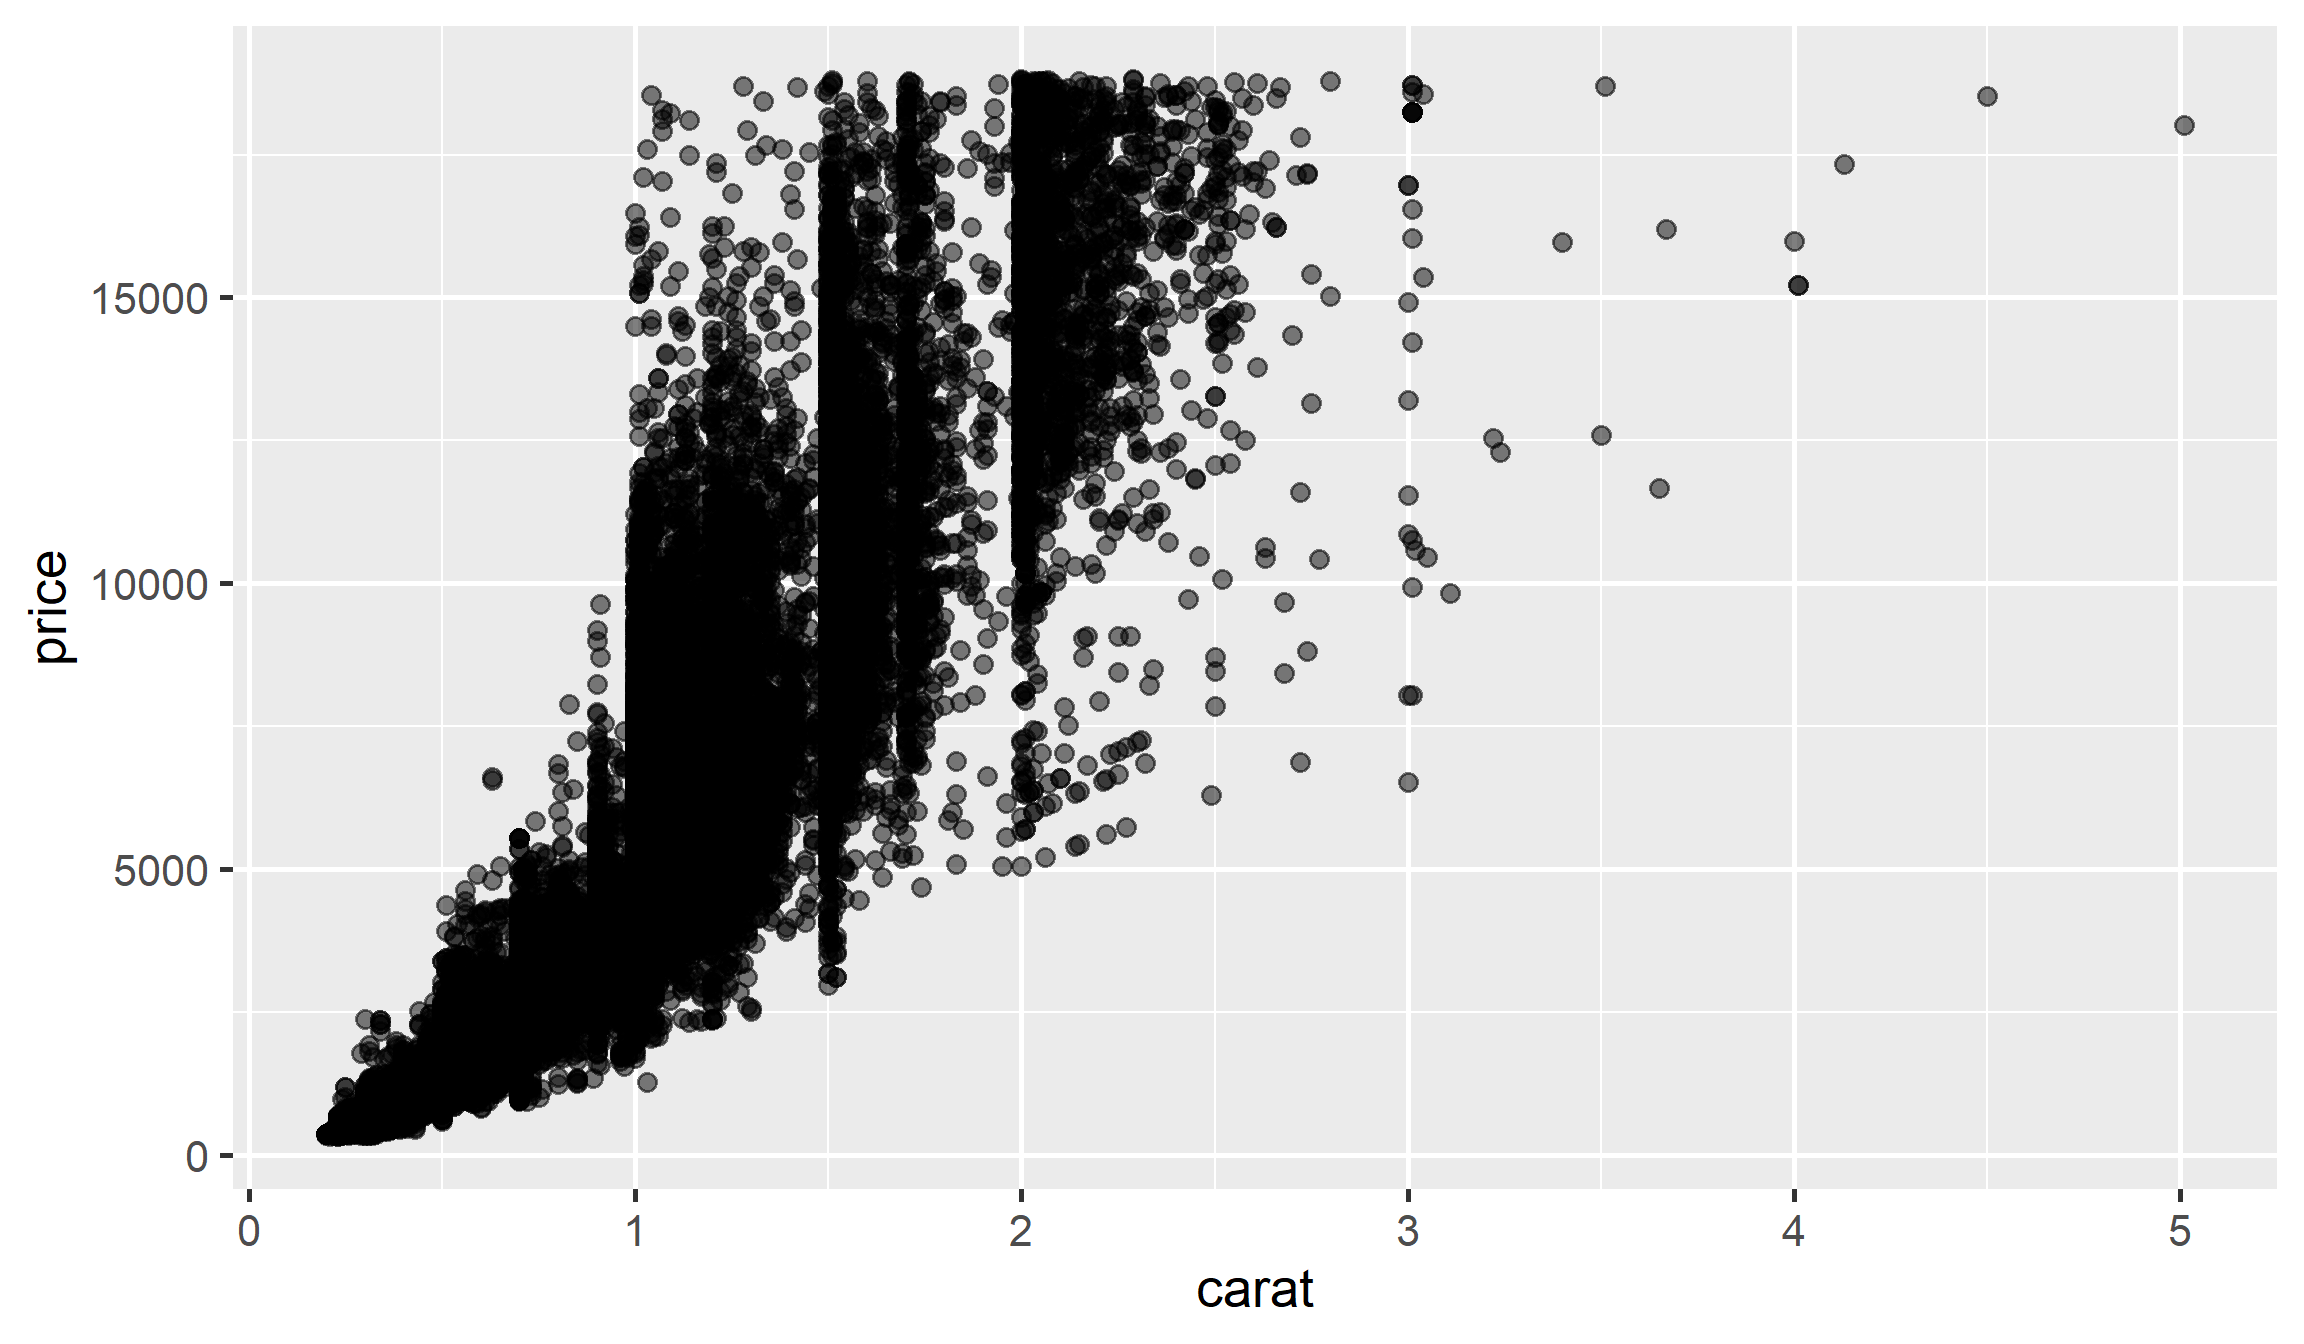
Binning into Hexes
# In such cases, we can count points within hexagonal bins
library(hexbin)
ggplot(diamonds, aes(x = carat, y = price)) + geom_hex()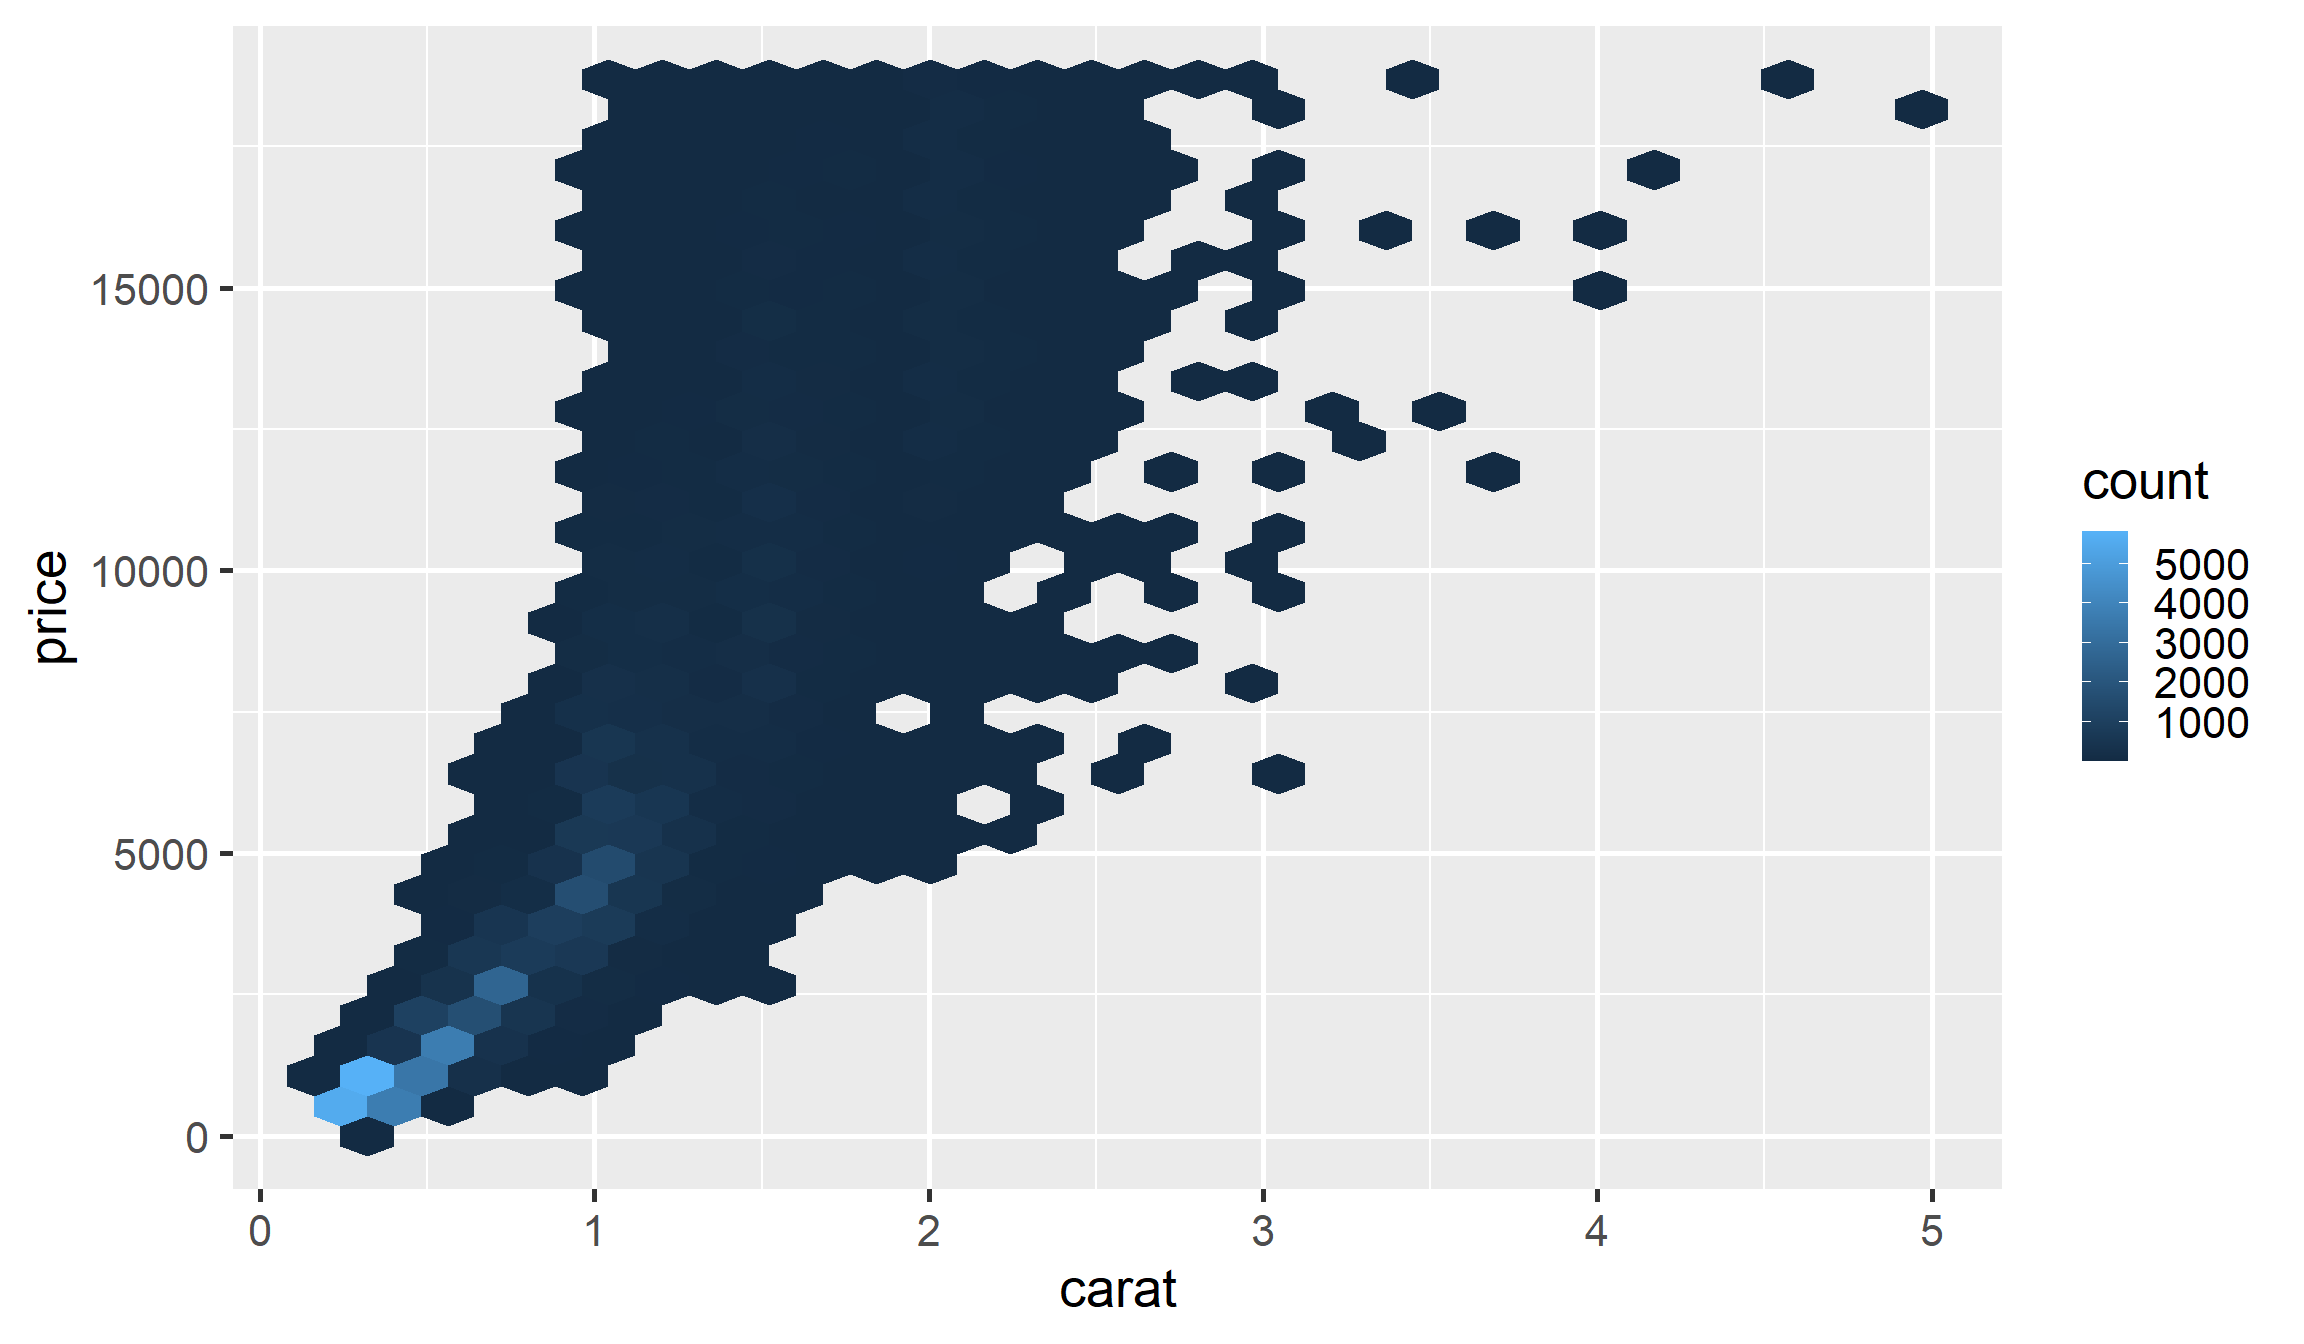
Discrete Overplotting
# With discrete x, we want to jitter horizontally only
ggplot(mpg, aes(x = drv, y = hwy)) + geom_point()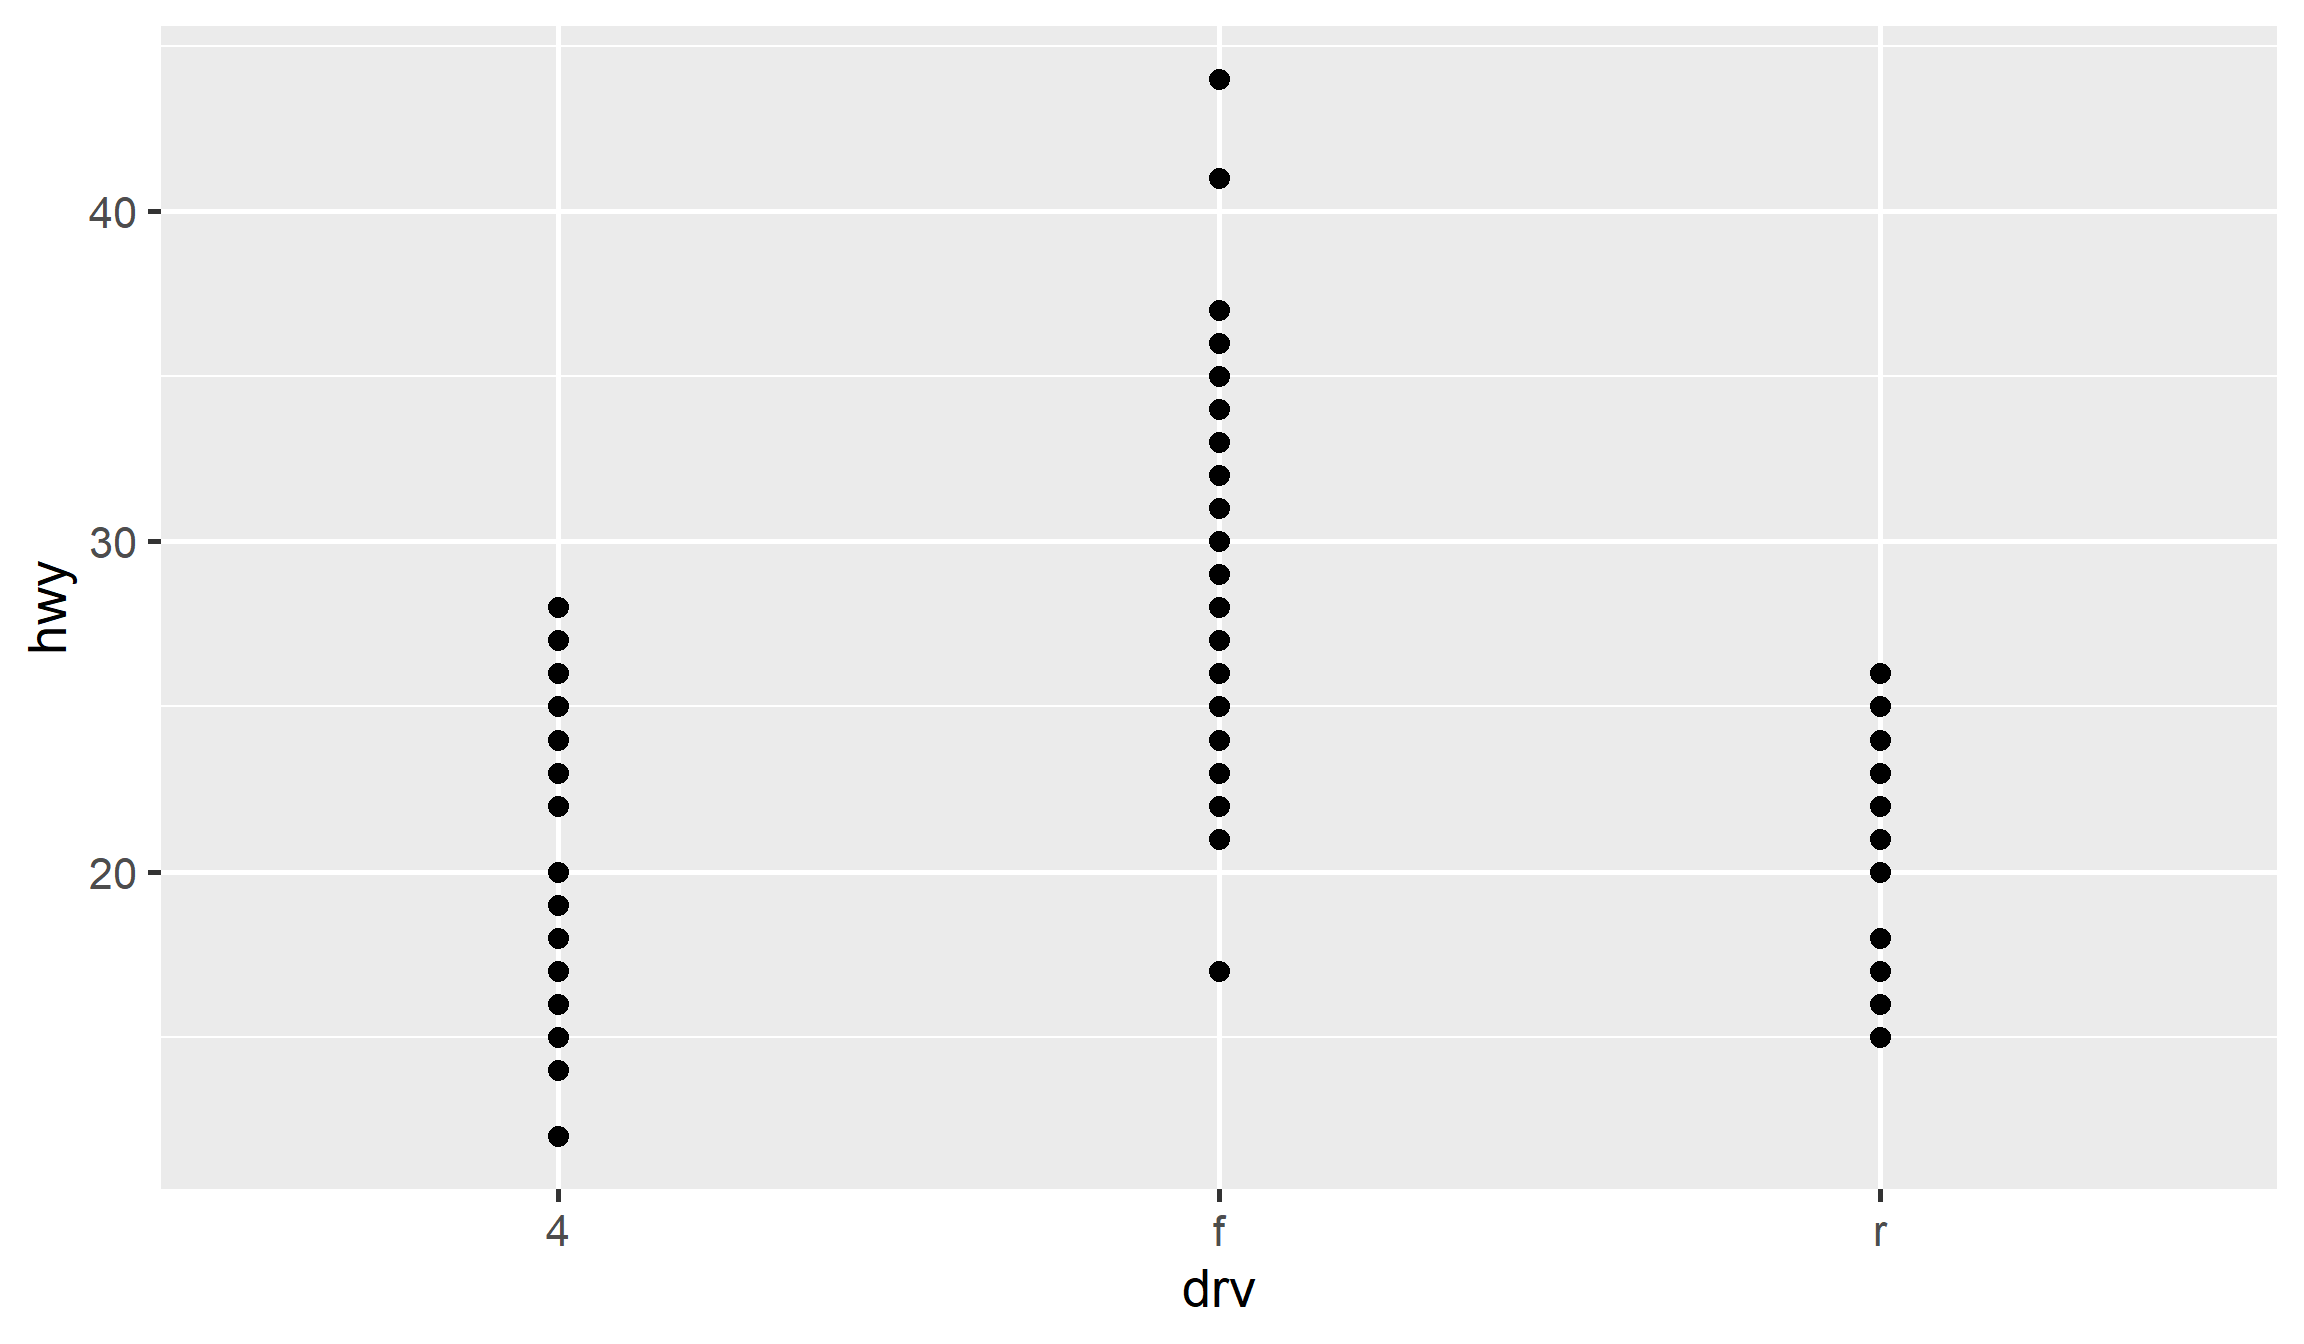
Horizontal Jitter
# Set height to 0 to only push left or right
ggplot(mpg, aes(x = drv, y = hwy)) +
  geom_point(position = position_jitter(width = 0.25, height = 0))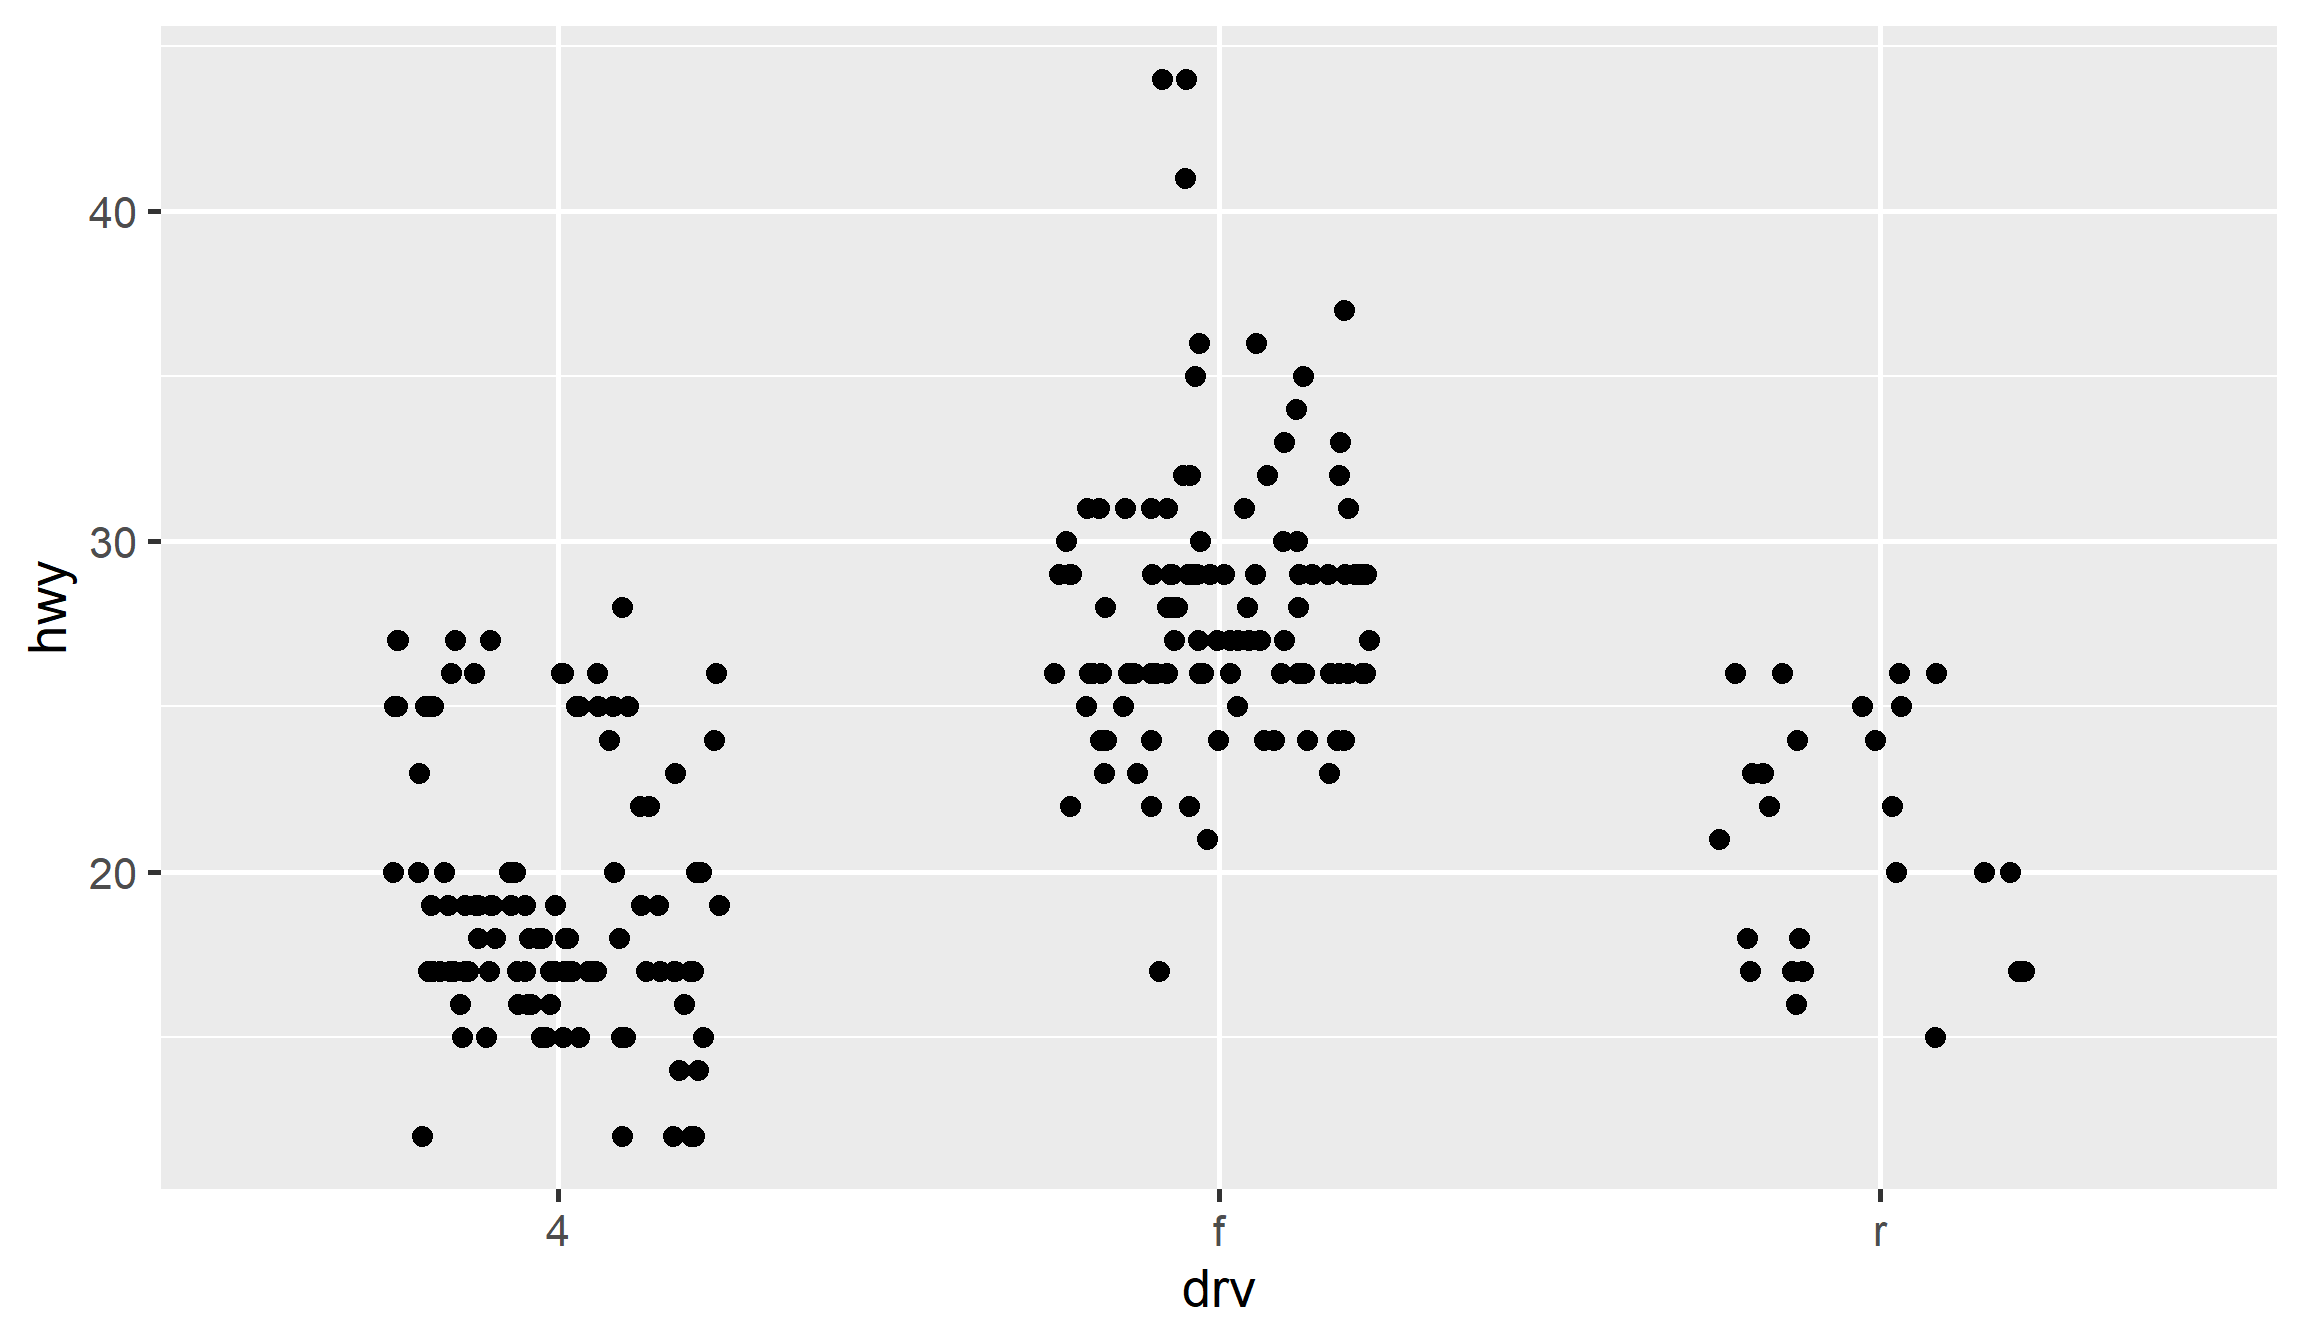
Discrete Overplotting
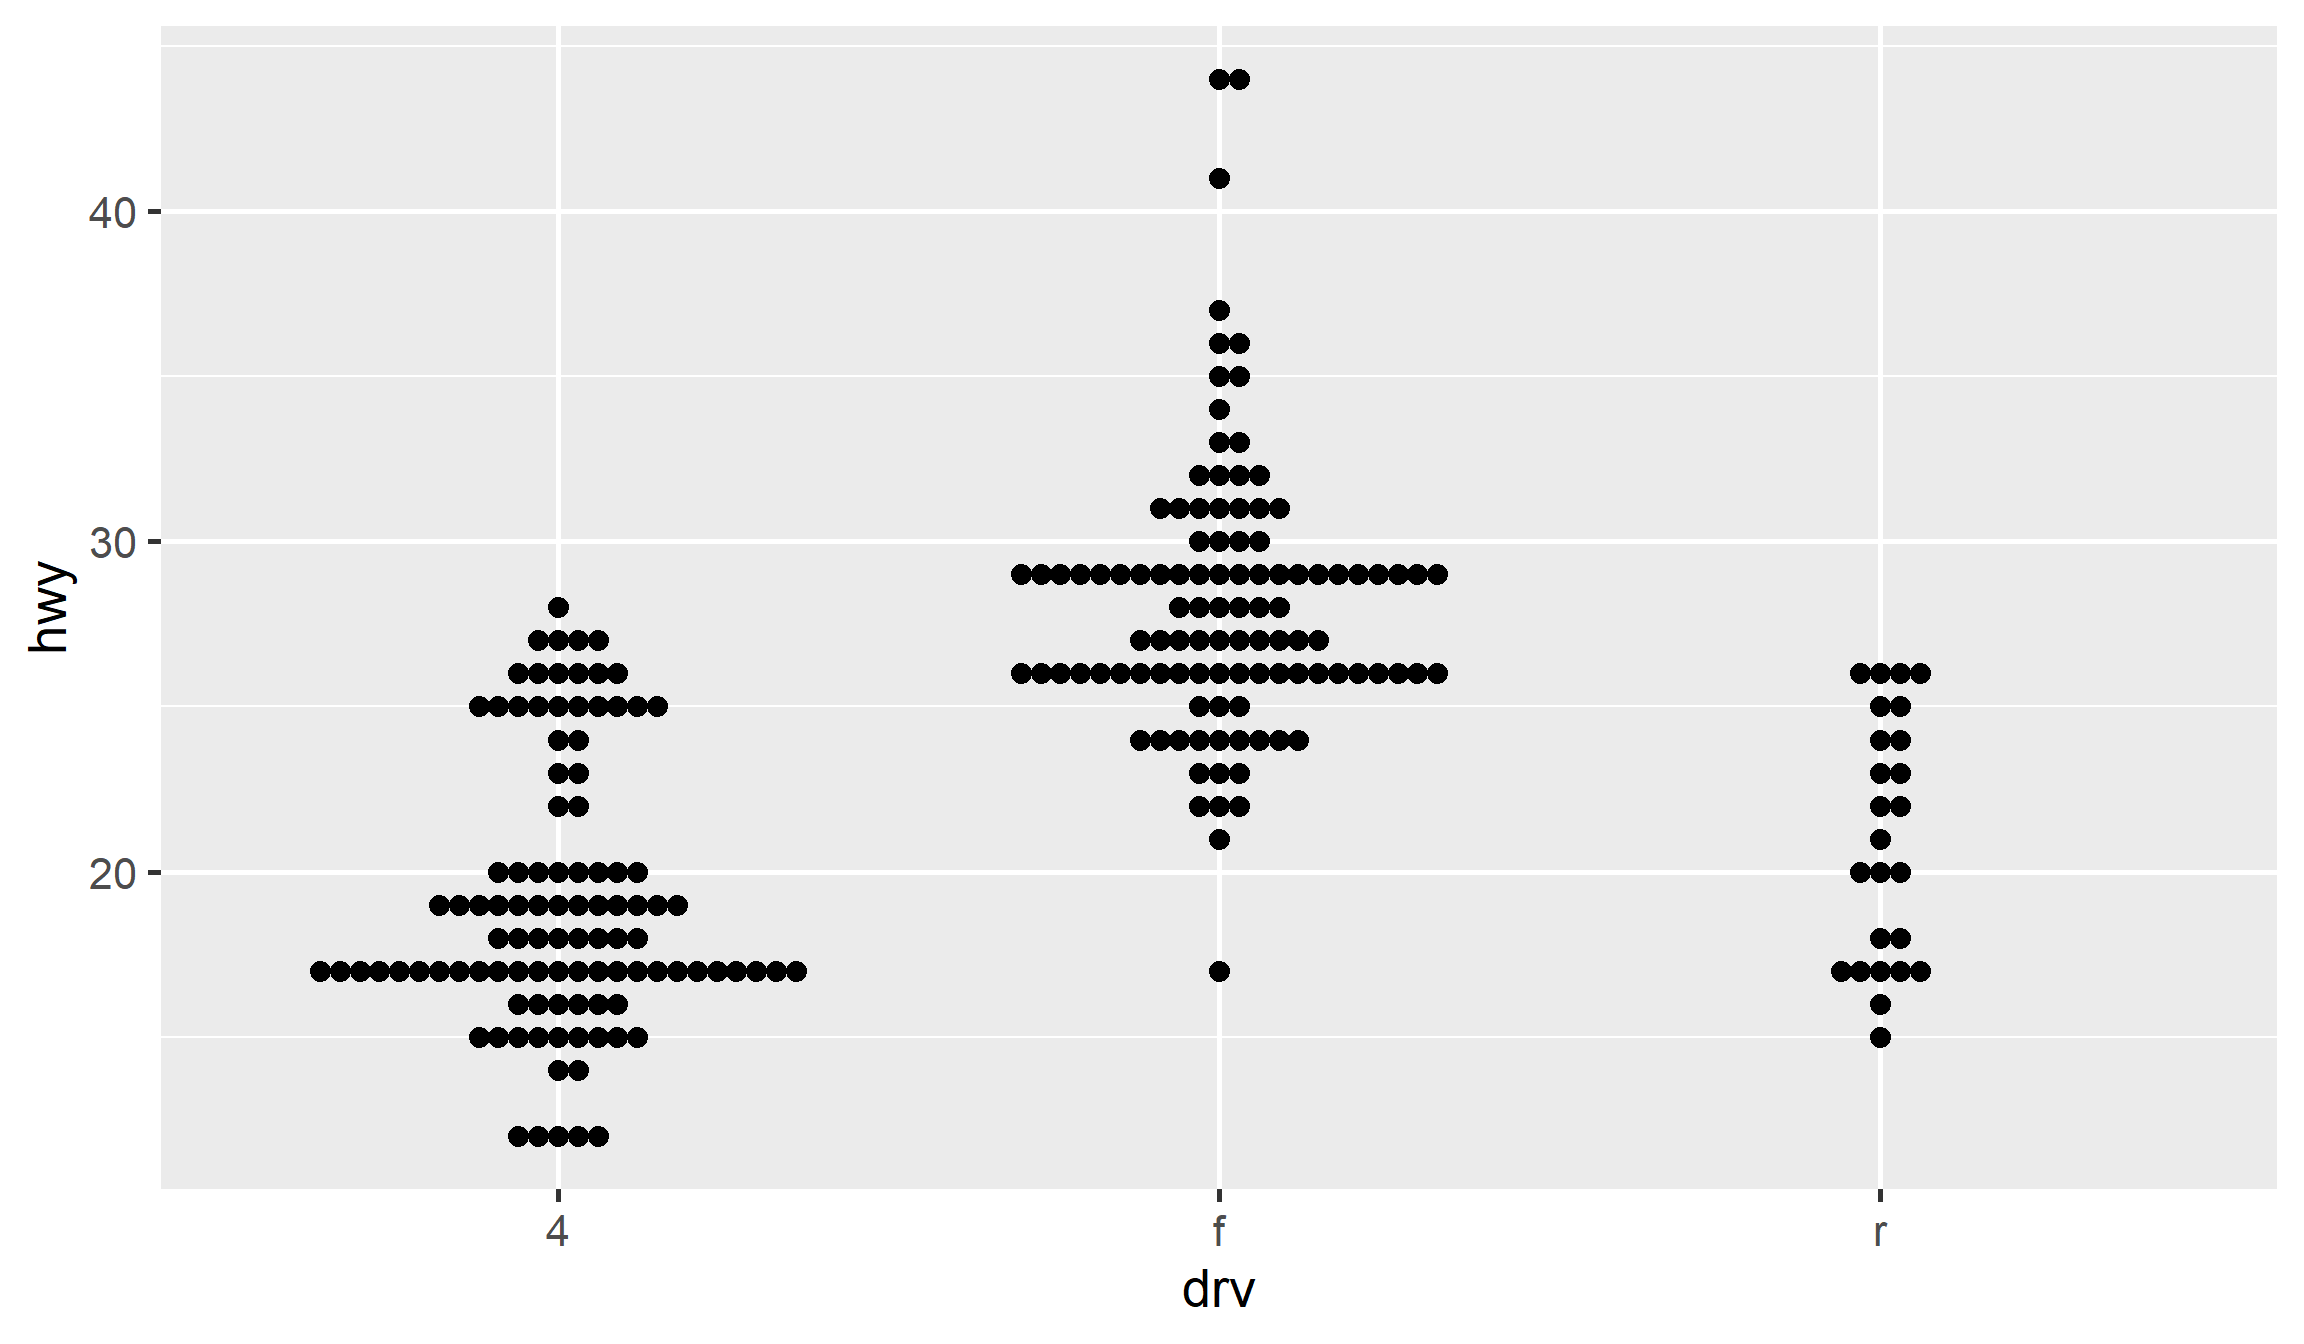
## Beeswarm plots can also handle discrete overplotting well
library(ggbeeswarm)
ggplot(mpg, aes(x = drv, y = hwy)) + geom_beeswarm()