Code
library(tidyverse)
library(easystats)
library(brms)
library(ordbetareg)
library(flextable)
library(patchwork)library(tidyverse)
library(easystats)
library(brms)
library(ordbetareg)
library(flextable)
library(patchwork)# Deidentified features (one row per participant and task); see ../data/README.md
df_visual <-
# base R's parser restores every stored value exactly (readr's can differ in the last digit)
read.csv(file.path("..", "data", "visual.csv")) |>
as_tibble() |>
mutate(
participant = factor(participant),
source = factor(source, levels = c("clinic", "prolific")),
ptsd = factor(ptsd, levels = c(0, 1)),
demo_sex = factor(demo_sex, levels = c("Male", "Female")),
demo_nonwhite = factor(demo_nonwhite, levels = c(FALSE, TRUE)),
task = factor(task, levels = c("Account", "Impact")),
# AU intensities (0-5) to proportions of the scale maximum
AU04 = AU04 / 5, # fear, sadness, anger
AU12 = AU12 / 5, # happiness
AU15 = AU15 / 5, # sadness, disgust
AU17 = AU17 / 5, # disgust
AU20 = AU20 / 5 # fear
) |>
arrange(participant, task)
# Effect-code every two-level factor (first level = -0.5, second = +0.5) so each main effect is averaged
# over the other factors (e.g., group = PTSD - Control averaged across tasks); interactions and predictions are unchanged
for (v in c("task", "ptsd", "demo_sex", "demo_nonwhite")) contrasts(df_visual[[v]]) <- c(-0.5, 0.5)
dir.create("fits", showWarnings = FALSE)
# High-ICC models whose between-person (group) coefficient mixed slowly at 4000 iterations
long_run <- c("CPPS", "H1H2", "M_Voiced", "SD_Voiced", "PoseX", "AU15")
df_visual |>
select(AU04:DiffY) |>
pivot_longer(cols = everything()) |>
ggplot(aes(x = value)) +
facet_wrap(~name, scales = "free") +
geom_histogram(bins = 30, na.rm = TRUE)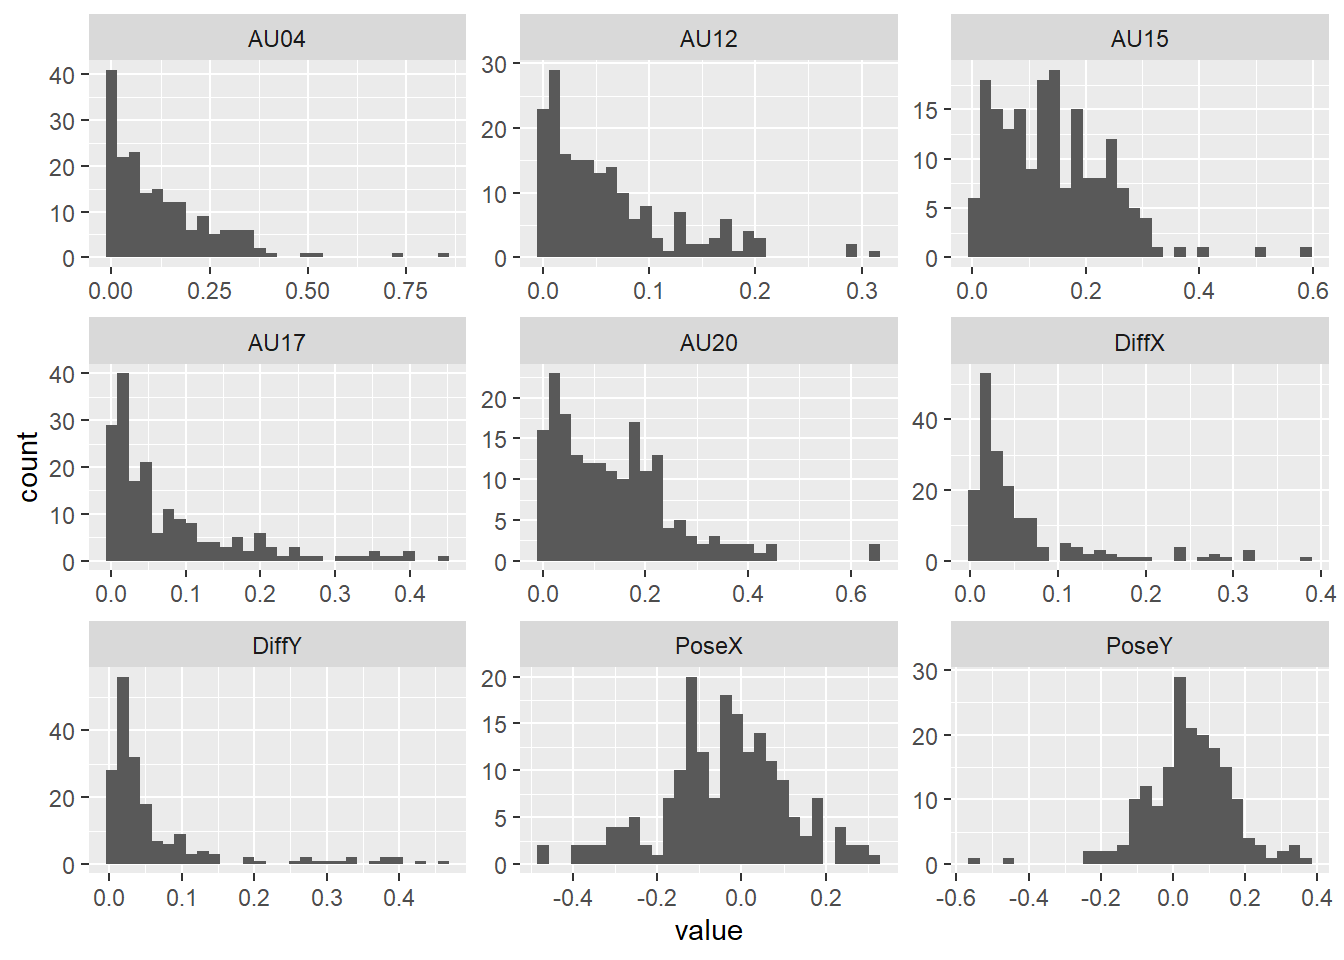
gaussian_features <- c("PoseX", "PoseY")

gaussian_models <-
  gaussian_features |>
  set_names() |>
  map(
    \(feature) {
      model_formula <- as.formula(
        paste(feature, "~ task * ptsd + demo_age + demo_sex + demo_nonwhite + (1 | participant)")
      )
      brm(
        formula = model_formula,
        data = df_visual,
        prior = set_prior("normal(0, 1)", class = "b"),
        seed = 2026,
        chains = 4,
        cores = 4,
        iter = if (feature %in% long_run) 8000 else 4000,
        warmup = 2000,
        refresh = 0,
        file = file.path("fits", feature),
        control = list(adapt_delta = 0.95, max_treedepth = 12),
        backend = "cmdstanr"
      )
    }
  )

iwalk(
  gaussian_models,
  \(model, name) {
    thisr2 <- r2(model)
    cat(
      "\n\n#### ",
      name,
      sprintf("(R2C = %0.2f, R2M = %0.2f)", thisr2$R2_Bayes, thisr2$R2_Bayes_marginal),
      "\n\n"
    )
    table_md <- print_md(model_parameters(model))
    cat(table_md, sep = "\n")
  }
)| Parameter | Median | 95% CI | pd | Rhat | ESS (tail) |
|---|---|---|---|---|---|
| (Intercept) | 0.02 | (-0.08, 0.13) | 67.08% | 1.002 | 5220 |
| task1 | 3.84e-03 | (-7.95e-03, 0.02) | 73.95% | 1.000 | 14875 |
| ptsd1 | -1.39e-03 | (-0.08, 0.08) | 51.65% | 1.001 | 4218 |
| demo_age | -1.91e-03 | (-4.26e-03, 4.40e-04) | 94.54% | 1.002 | 4695 |
| demo_sex1 | -0.03 | (-0.10, 0.04) | 79.55% | 1.001 | 4601 |
| demo_nonwhite1 | -0.06 | (-0.15, 0.03) | 91.12% | 1.003 | 5371 |
| task1:ptsd1 | 2.73e-03 | (-0.02, 0.03) | 59.24% | 1.000 | 14907 |
| Parameter | Median | 95% CI | pd | Rhat | ESS (tail) |
|---|---|---|---|---|---|
| sigma | 0.04 | (0.03, 0.05) | 100% | 1.000 | 12802 |
| Parameter | Median | 95% CI | pd | Rhat | ESS (tail) |
|---|---|---|---|---|---|
| (Intercept) | 0.09 | (0.02, 0.18) | 99.09% | 1.003 | 1242 |
| task1 | 2.22e-03 | (-7.75e-03, 0.01) | 66.86% | 1.000 | 5908 |
| ptsd1 | -3.15e-03 | (-0.06, 0.06) | 54.02% | 1.004 | 1592 |
| demo_age | -1.54e-03 | (-3.57e-03, 2.34e-04) | 95.55% | 1.002 | 1281 |
| demo_sex1 | 0.04 | (-0.03, 0.09) | 87.76% | 1.005 | 1397 |
| demo_nonwhite1 | -0.02 | (-0.10, 0.05) | 72.02% | 1.006 | 1744 |
| task1:ptsd1 | 0.02 | (-5.12e-03, 0.03) | 93.14% | 1.001 | 5406 |
| Parameter | Median | 95% CI | pd | Rhat | ESS (tail) |
|---|---|---|---|---|---|
| sigma | 0.03 | (0.03, 0.04) | 100% | 1.000 | 4191 |
invgaussian_features <- c("DiffX", "DiffY")

invgaussian_models <-
  invgaussian_features |>
  set_names() |>
  map(
    \(feature) {
      model_formula <- as.formula(
        paste(feature, "~ task * ptsd + demo_age + demo_sex + demo_nonwhite + (1 | participant)")
      )
      brm(
        formula = model_formula,
        data = df_visual,
        family = inverse.gaussian(link = "log"),
        prior = set_prior("normal(0, 1)", class = "b"),
        seed = 2026,
        chains = 4,
        cores = 4,
        iter = if (feature %in% long_run) 8000 else 4000,
        warmup = 2000,
        refresh = 0,
        file = file.path("fits", feature),
        control = list(adapt_delta = 0.95, max_treedepth = 12),
        backend = "cmdstanr"
      )
    }
  )


iwalk(
  invgaussian_models,
  \(model, name) {
    thisr2 <- r2(model)
    cat(
      "\n\n#### ",
      name,
      sprintf("(R2C = %0.2f, R2M = %0.2f)", thisr2$R2_Bayes, thisr2$R2_Bayes_marginal),
      "\n\n"
    )
    table_md <- print_md(model_parameters(model))
    cat(table_md, sep = "\n")
  }
)| Parameter | Median | 95% CI | pd | Rhat | ESS (tail) |
|---|---|---|---|---|---|
| (Intercept) | -2.63 | (-3.29, -1.92) | 100% | 1.005 | 2646 |
| task1 | -0.04 | (-0.18, 0.10) | 71.67% | 1.002 | 5888 |
| ptsd1 | -0.08 | (-0.58, 0.40) | 63.24% | 1.002 | 2543 |
| demo_age | -0.02 | (-0.03, -2.36e-03) | 98.88% | 1.006 | 2702 |
| demo_sex1 | 0.54 | (0.07, 1.01) | 98.76% | 1.002 | 2393 |
| demo_nonwhite1 | -0.14 | (-0.72, 0.44) | 68.91% | 1.002 | 3001 |
| task1:ptsd1 | -2.95e-03 | (-0.28, 0.27) | 50.90% | 1.000 | 5757 |
| Parameter | Median | 95% CI | pd | Rhat | ESS (tail) |
|---|---|---|---|---|---|
| (Intercept) | -2.56 | (-3.34, -1.75) | 100% | 1.002 | 2786 |
| task1 | 0.08 | (-0.08, 0.23) | 83.40% | 1.000 | 6145 |
| ptsd1 | -7.31e-03 | (-0.56, 0.54) | 51.05% | 1.002 | 2985 |
| demo_age | -0.02 | (-0.04, -1.48e-03) | 98.26% | 1.003 | 2831 |
| demo_sex1 | 0.48 | (-0.03, 1.02) | 96.66% | 1.001 | 2786 |
| demo_nonwhite1 | -0.27 | (-0.93, 0.38) | 78.77% | 1.001 | 2868 |
| task1:ptsd1 | 0.05 | (-0.26, 0.35) | 62.31% | 1.001 | 6011 |
ob_features <- c("AU04", "AU12", "AU15", "AU17", "AU20")

ob_models <-
  ob_features |>
  set_names() |>
  map(
    \(feature) {
      model_formula <- as.formula(
        paste(feature, "~ task * ptsd + demo_age + demo_sex + demo_nonwhite + (1 | participant)")
      )
      ordbetareg(
        formula = model_formula,
        data = df_visual,
        coef_prior_mean = 0,
        coef_prior_SD = 1,
        seed = 2026,
        chains = 4,
        cores = 4,
        iter = if (feature %in% long_run) 8000 else 4000,
        warmup = 2000,
        refresh = 0,
        file = file.path("fits", feature),
        control = list(adapt_delta = 0.95, max_treedepth = 12),
        backend = "cmdstanr"
      )
    }
  )


iwalk(
  ob_models,
  \(model, name) {
    thisr2 <- r2(model)
    cat(
      "\n\n#### ",
      name,
      sprintf("(R2C = %0.2f, R2M = %0.2f)", thisr2$R2_Bayes, thisr2$R2_Bayes_marginal),
      "\n\n"
    )
    table_md <- print_md(model_parameters(model))
    cat(table_md, sep = "\n")
  }
)| Parameter | Median | 95% CI | pd | Rhat | ESS (tail) |
|---|---|---|---|---|---|
| (Intercept) | -4.23 | (-5.16, -3.30) | 100% | 1.002 | 1429 |
| task1 | 0.02 | (-0.10, 0.13) | 59.96% | 1.000 | 5524 |
| ptsd1 | 0.15 | (-0.48, 0.77) | 67.58% | 1.003 | 1612 |
| demo_age | 0.03 | (0.01, 0.06) | 99.88% | 1.003 | 1277 |
| demo_sex1 | 0.44 | (-0.20, 1.05) | 90.44% | 1.002 | 1530 |
| demo_nonwhite1 | -0.70 | (-1.43, 0.09) | 96.05% | 1.004 | 2213 |
| task1:ptsd1 | -0.09 | (-0.31, 0.15) | 77.42% | 1.001 | 5730 |
| Parameter | Median | 95% CI | pd | Rhat | ESS (tail) |
|---|---|---|---|---|---|
| (Intercept) | -3.24 | (-4.03, -2.45) | 100% | 1.001 | 1982 |
| task1 | 0.11 | (-0.02, 0.24) | 95.73% | 1.000 | 6043 |
| ptsd1 | 0.05 | (-0.51, 0.61) | 56.62% | 1.001 | 2235 |
| demo_age | 5.50e-03 | (-0.01, 0.02) | 72.19% | 1.001 | 2065 |
| demo_sex1 | -0.29 | (-0.81, 0.23) | 85.61% | 1.002 | 2496 |
| demo_nonwhite1 | 0.26 | (-0.37, 0.89) | 79.01% | 1.004 | 2582 |
| task1:ptsd1 | 0.20 | (-0.05, 0.46) | 93.73% | 1.001 | 6443 |
| Parameter | Median | 95% CI | pd | Rhat | ESS (tail) |
|---|---|---|---|---|---|
| (Intercept) | -3.12 | (-3.75, -2.50) | 100% | 1.001 | 3463 |
| task1 | 0.02 | (-0.04, 0.08) | 73.45% | 1.000 | 16871 |
| ptsd1 | 0.56 | (0.12, 0.99) | 99.39% | 1.002 | 3453 |
| demo_age | 0.03 | (0.02, 0.04) | 100.00% | 1.003 | 3109 |
| demo_sex1 | -0.26 | (-0.70, 0.16) | 88.84% | 1.002 | 3052 |
| demo_nonwhite1 | 0.37 | (-0.12, 0.89) | 92.82% | 1.002 | 3512 |
| task1:ptsd1 | -0.09 | (-0.22, 0.04) | 91.50% | 1.000 | 15887 |
| Parameter | Median | 95% CI | pd | Rhat | ESS (tail) |
|---|---|---|---|---|---|
| (Intercept) | -4.34 | (-5.22, -3.52) | 100% | 1.002 | 2363 |
| task1 | 0.07 | (-0.02, 0.16) | 94.30% | 1.001 | 5478 |
| ptsd1 | 0.54 | (-0.03, 1.11) | 96.83% | 1.004 | 2544 |
| demo_age | 0.03 | (0.01, 0.05) | 99.95% | 1.002 | 1696 |
| demo_sex1 | -1.06 | (-1.62, -0.47) | 99.98% | 1.003 | 1919 |
| demo_nonwhite1 | -0.11 | (-0.79, 0.60) | 62.99% | 1.003 | 2625 |
| task1:ptsd1 | 0.07 | (-0.10, 0.24) | 79.95% | 1.000 | 4921 |
| Parameter | Median | 95% CI | pd | Rhat | ESS (tail) |
|---|---|---|---|---|---|
| (Intercept) | -3.07 | (-3.88, -2.23) | 100% | 1.012 | 1336 |
| task1 | -0.04 | (-0.13, 0.06) | 77.69% | 1.001 | 5108 |
| ptsd1 | 0.07 | (-0.52, 0.65) | 59.59% | 1.006 | 1473 |
| demo_age | 0.02 | (2.71e-03, 0.04) | 98.72% | 1.014 | 1336 |
| demo_sex1 | 0.19 | (-0.37, 0.75) | 74.95% | 1.004 | 1683 |
| demo_nonwhite1 | 0.37 | (-0.35, 1.04) | 85.22% | 1.003 | 1365 |
| task1:ptsd1 | -0.03 | (-0.23, 0.16) | 63.36% | 1.000 | 5628 |
all_models <- c(gaussian_models, invgaussian_models, ob_models)

extract_model_stats <- function(model, model_name) {
  describe_posterior(model, effects = "fixed", component = "conditional", test = "pd") |>
    as_tibble() |>
    filter(str_detect(Parameter, "task|ptsd")) |>
    mutate(
      stars = case_when(
        pd >= 0.995 ~ "***",
        pd >= 0.985 ~ "**",
        pd >= 0.975 ~ "*",
        TRUE        ~ ""
      ),
      formatted_stat = sprintf("%.2f [%.2f, %.2f]%s", Median, CI_low, CI_high, stars),

      Term = case_when(
        str_detect(Parameter, ":") ~ "Interaction",
        str_detect(Parameter, "task") ~ "Main_Task",
        str_detect(Parameter, "ptsd") ~ "Main_PTSD",
        TRUE ~ Parameter
      )
    ) |>
    select(Term, formatted_stat) |>
    pivot_wider(names_from = Term, values_from = formatted_stat) |>
    mutate(Feature = model_name, .before = 1)
}

table_data <- imap(all_models, \(model, name) extract_model_stats(model, name)) |>
  list_rbind()

final_table <-
  flextable(table_data) |>
  set_header_labels(
    Feature = "Feature",
    Main_Task = "Main Effect: Task",
    Main_PTSD = "Main Effect: PTSD",
    Interaction = "Task × PTSD Effect"
  ) |>
  autofit() |>
  add_footer_lines("Note: Estimates are median posterior values on the link scale (identity, log, or logit). Models control for age, sex, and race. Brackets indicate 95% Credible Intervals. * pd > 97.5%, ** pd > 98.5%, *** pd > 99.5%. ")

final_table
Feature | Main Effect: Task | Main Effect: PTSD | Task × PTSD Effect |
|---|---|---|---|
PoseX | 0.00 [-0.01, 0.02] | -0.00 [-0.08, 0.08] | 0.00 [-0.02, 0.03] |
PoseY | 0.00 [-0.01, 0.01] | -0.00 [-0.06, 0.06] | 0.02 [-0.01, 0.03] |
DiffX | -0.04 [-0.18, 0.10] | -0.08 [-0.58, 0.40] | -0.00 [-0.28, 0.27] |
DiffY | 0.08 [-0.08, 0.23] | -0.01 [-0.56, 0.54] | 0.05 [-0.26, 0.35] |
AU04 | 0.02 [-0.10, 0.13] | 0.15 [-0.48, 0.77] | -0.09 [-0.31, 0.15] |
AU12 | 0.11 [-0.02, 0.24] | 0.05 [-0.51, 0.61] | 0.20 [-0.05, 0.46] |
AU15 | 0.02 [-0.04, 0.08] | 0.56 [0.12, 0.99]** | -0.09 [-0.22, 0.04] |
AU17 | 0.07 [-0.02, 0.16] | 0.54 [-0.03, 1.11] | 0.07 [-0.10, 0.24] |
AU20 | -0.04 [-0.13, 0.06] | 0.07 [-0.52, 0.65] | -0.03 [-0.23, 0.16] |
Note: Estimates are median posterior values on the link scale (identity, log, or logit). Models control for age, sex, and race. Brackets indicate 95% Credible Intervals. * pd > 97.5%, ** pd > 98.5%, *** pd > 99.5%. | |||
# Simple group effects (PTSD - Control) within each task on the response scale,
# averaged over sex and race (equal weights, matching the effect coding) at the
# mean age, with random intercepts at zero
extract_group_deltas <- function(model, model_name) {
  ec <- estimate_contrasts(model, contrast = "ptsd", by = "task", re_formula = NA) |>
    as.data.frame()
  stopifnot(all(ec$Level1 == "1" & ec$Level2 == "0"))  # PTSD minus Control
  ec |>
    transmute(
      Feature = model_name,
      Task = as.character(task),
      Estimate = Median,
      CI_Low = CI_low,
      CI_High = CI_high,
      pd
    )
}

group_delta_results <- imap(all_models, \(model, name) {
  extract_group_deltas(model, name)
}) |> list_rbind()

group_delta_table <-
  group_delta_results |>
  mutate(Feature = gsub("_", " ", Feature)) |>
  flextable() |>
  colformat_double(
    j = c("Estimate", "CI_Low", "CI_High"),
    digits = 3
  ) |>
  colformat_double(
    j = "pd",
    digits = 3
  ) |>
  set_header_labels(
    Feature = "Feature",
    Task = "Task",
    Estimate = "PTSD Δ", # PTSD minus Control
    CI_Low = "Lower 95% CI",
    CI_High = "Upper 95% CI",
    pd = "pd"
  ) |>
  autofit() |>
  italic(j = "pd", part = "header") |>
  bold(i = ~ pd > 0.975, j = c("Estimate", "pd")) |>
  add_footer_lines("Note: PTSD Δ is the estimated difference (PTSD - Control) on the response scale, averaged over sex and race at the mean age. pd = Probability of Direction. Bold rows indicate pd > 0.975.")

group_delta_table
Feature | Task | PTSD Δ | Lower 95% CI | Upper 95% CI | pd |
|---|---|---|---|---|---|
PoseX | Account | -0.003 | -0.079 | 0.075 | 0.529 |
PoseX | Impact | -0.000 | -0.076 | 0.078 | 0.503 |
PoseY | Account | -0.011 | -0.071 | 0.052 | 0.635 |
PoseY | Impact | 0.005 | -0.056 | 0.068 | 0.553 |
DiffX | Account | -0.003 | -0.024 | 0.016 | 0.624 |
DiffX | Impact | -0.003 | -0.023 | 0.016 | 0.631 |
DiffY | Account | -0.001 | -0.022 | 0.020 | 0.546 |
DiffY | Impact | 0.001 | -0.022 | 0.025 | 0.523 |
AU04 | Account | 0.011 | -0.026 | 0.052 | 0.715 |
AU04 | Impact | 0.006 | -0.031 | 0.046 | 0.627 |
AU12 | Account | -0.002 | -0.030 | 0.026 | 0.572 |
AU12 | Impact | 0.007 | -0.021 | 0.040 | 0.698 |
AU15 | Account | 0.070 | 0.018 | 0.130 | 0.996 |
AU15 | Impact | 0.061 | 0.009 | 0.120 | 0.989 |
AU17 | Account | 0.026 | -0.004 | 0.070 | 0.958 |
AU17 | Impact | 0.032 | 0.000 | 0.079 | 0.975 |
AU20 | Account | 0.008 | -0.051 | 0.069 | 0.614 |
AU20 | Impact | 0.005 | -0.052 | 0.065 | 0.573 |
Note: PTSD Δ is the estimated difference (PTSD - Control) on the response scale, averaged over sex and race at the mean age. pd = Probability of Direction. Bold rows indicate pd > 0.975. | |||||
plot_titles <- c(
  "Pose: Vertical (Pitch)",
  "Pose: Horizontal (Yaw)",
  "Motion: Vertical (Pitch)",
  "Motion: Horizontal (Yaw)",
  "AU04: Brow lowerer",
  "AU12: Lip corner puller",
  "AU15: Lip corner depressor",
  "AU17: Chin raiser",
  "AU20: Mouth stretcher"
)

# Plot the simple group effects from the table above: PTSD minus Control within
# each task, with 95% credible intervals; filled points have pd > 97.5%
make_model_plot <- function(name, title) {
  d <- group_delta_results |>
    filter(Feature == name) |>
    mutate(
      Task = factor(Task, levels = c("Account", "Impact")),
      credible = factor(pd > 0.975, levels = c(FALSE, TRUE), labels = c("No", "Yes"))
    )
  ggplot(d, aes(x = Task, y = Estimate, group = 1)) +
    geom_hline(yintercept = 0, linetype = "dashed", color = "grey50") +
    geom_line(color = "grey40") +
    geom_pointrange(
      aes(ymin = CI_Low, ymax = CI_High, fill = credible),
      shape = 21, size = 0.4, color = "grey20", show.legend = TRUE
    ) +
    scale_fill_manual(values = c(No = "white", Yes = "black"), limits = c("No", "Yes"), drop = FALSE) +
    # typographic minus signs on the y-axis (Cairo otherwise draws a hyphen)
    scale_y_continuous(labels = \(x) sub("^-", "\u2212", format(x, trim = TRUE))) +
    labs(title = title, x = NULL, y = "PTSD − Control Difference (95% CI)", fill = "pd > 97.5%") +
    theme_minimal(base_size = 8) +
    theme(
      plot.title = element_text(size = 9, face = "bold"),
      axis.text.x = element_text(size = 8),
      panel.grid.minor = element_blank(),
      panel.grid.major.x = element_blank()
    )
}

plot_list <- map2(names(all_models), plot_titles, make_model_plot)

combined_plot <- wrap_plots(plot_list, ncol = 3) +
  plot_layout(guides = "collect", axis_titles = "collect") &
  theme(legend.position = "bottom")

combined_plot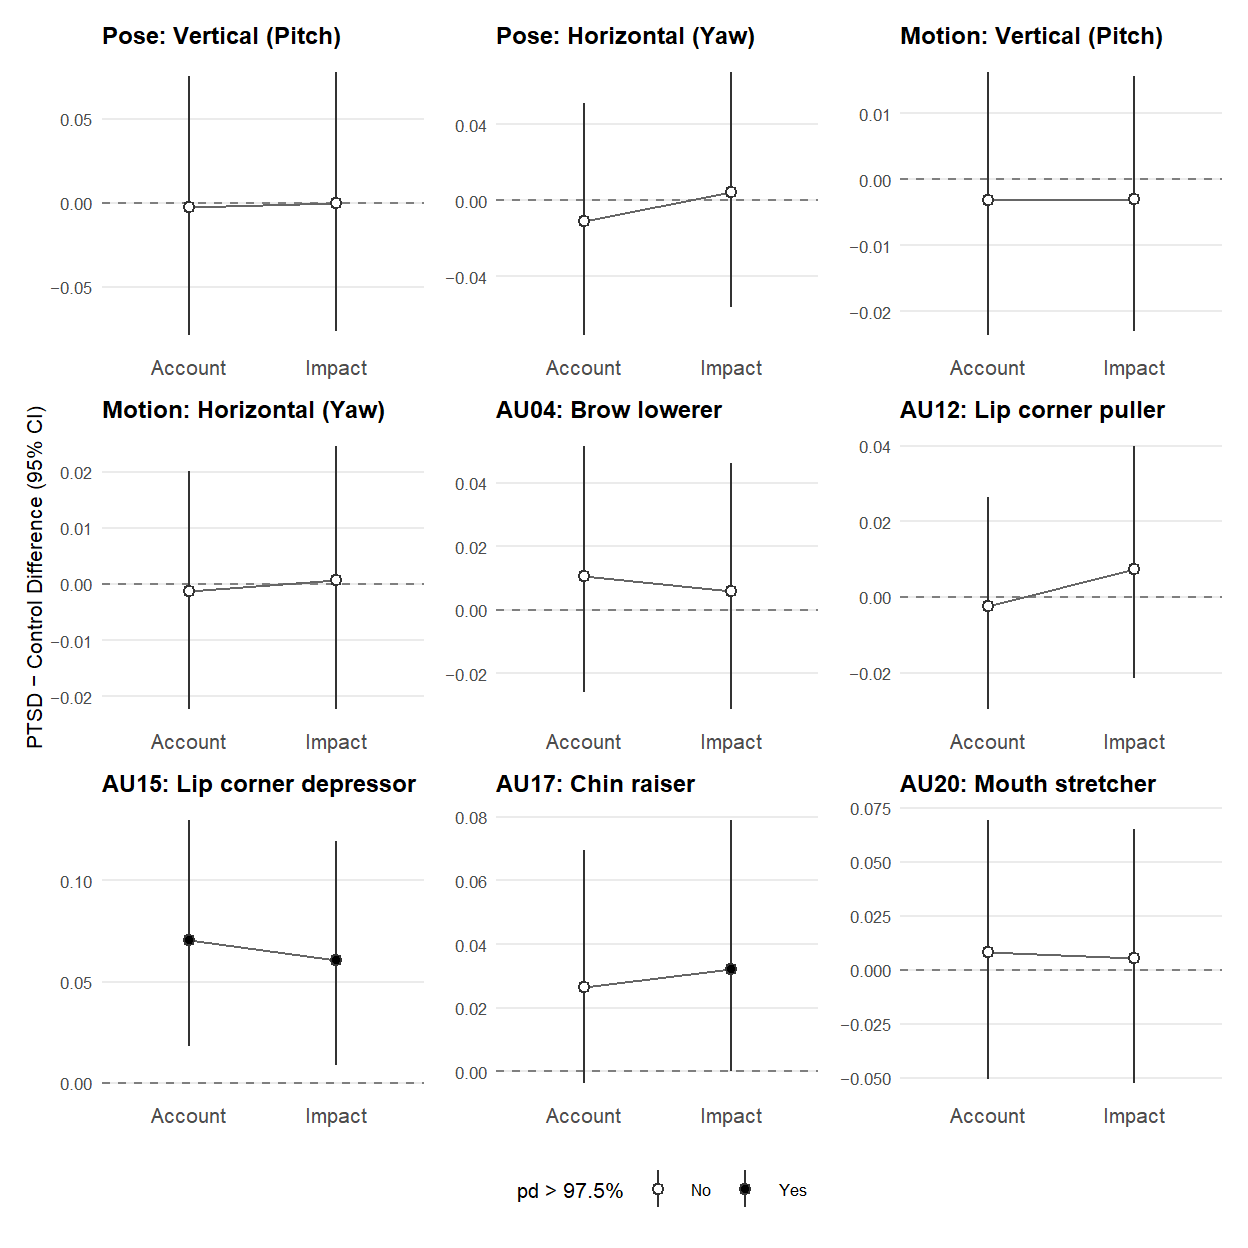
# Cairo embeds fonts and renders hyphens and minus signs correctly
ggsave("visual.pdf", width = 6.5, height = 6.5, units = "in", device = cairo_pdf)
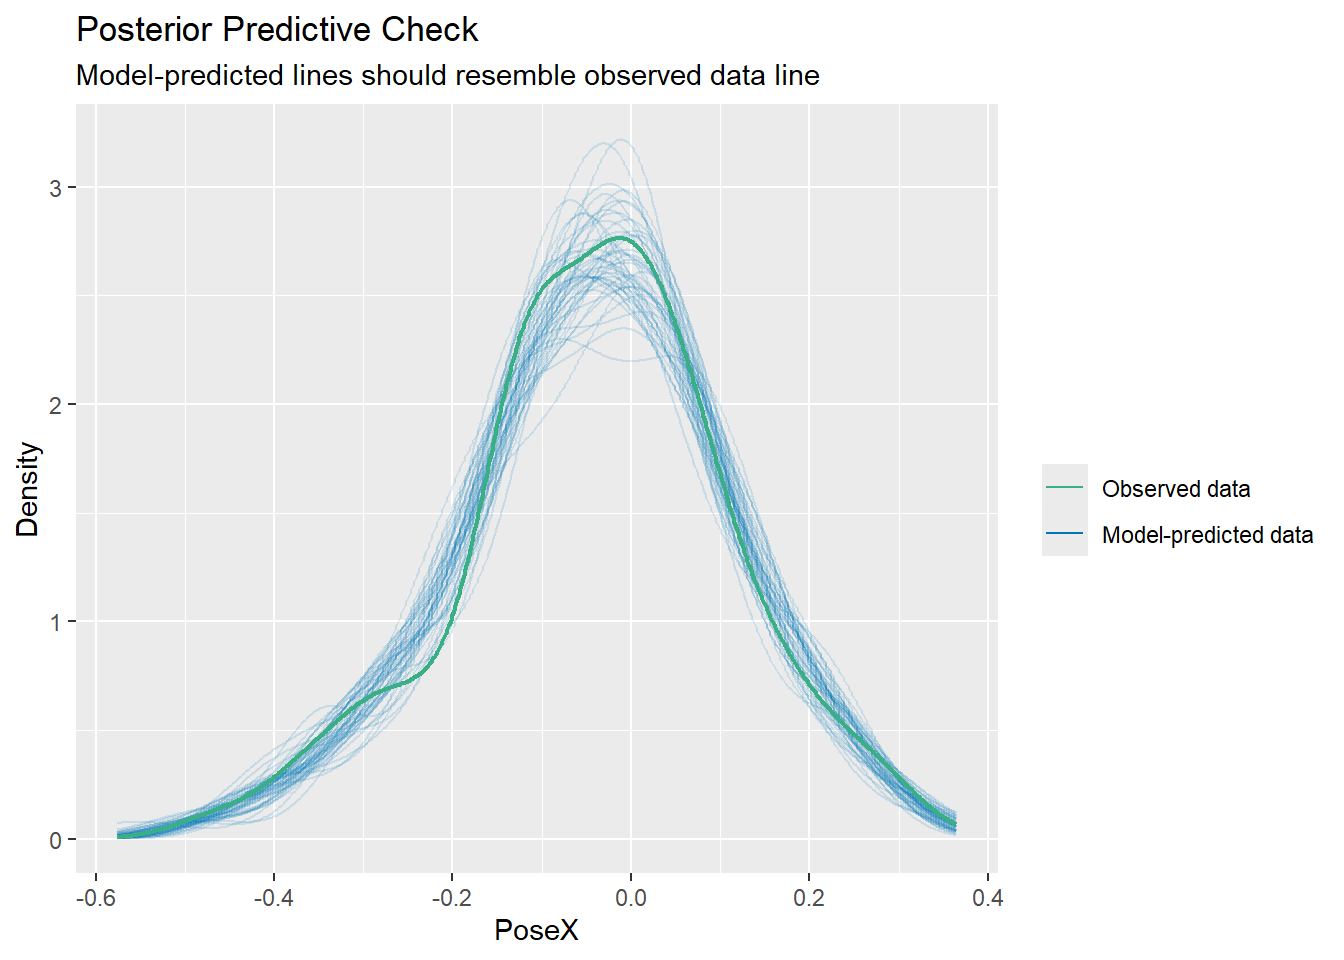
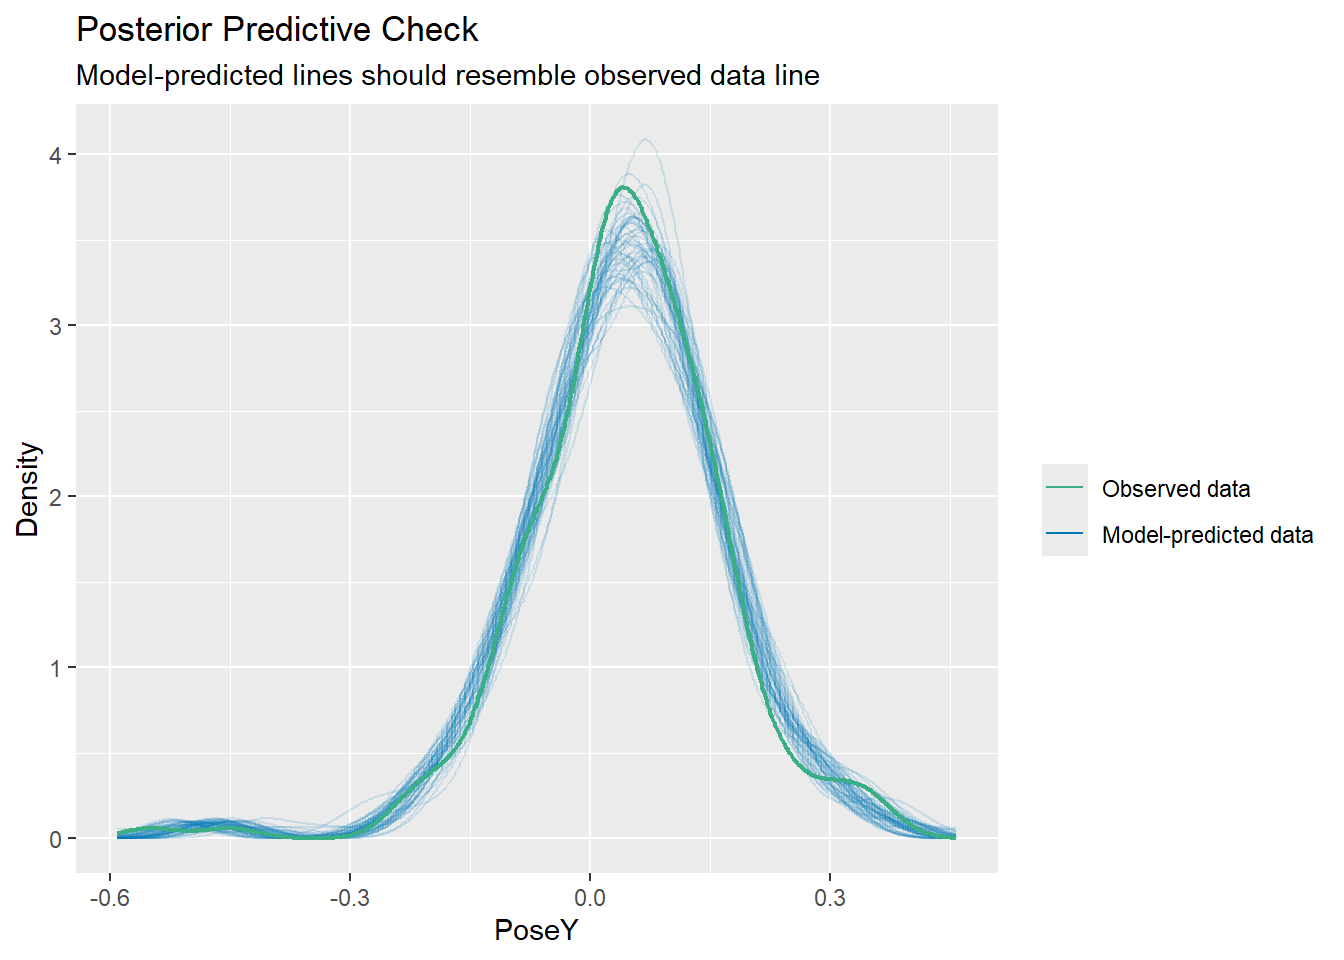
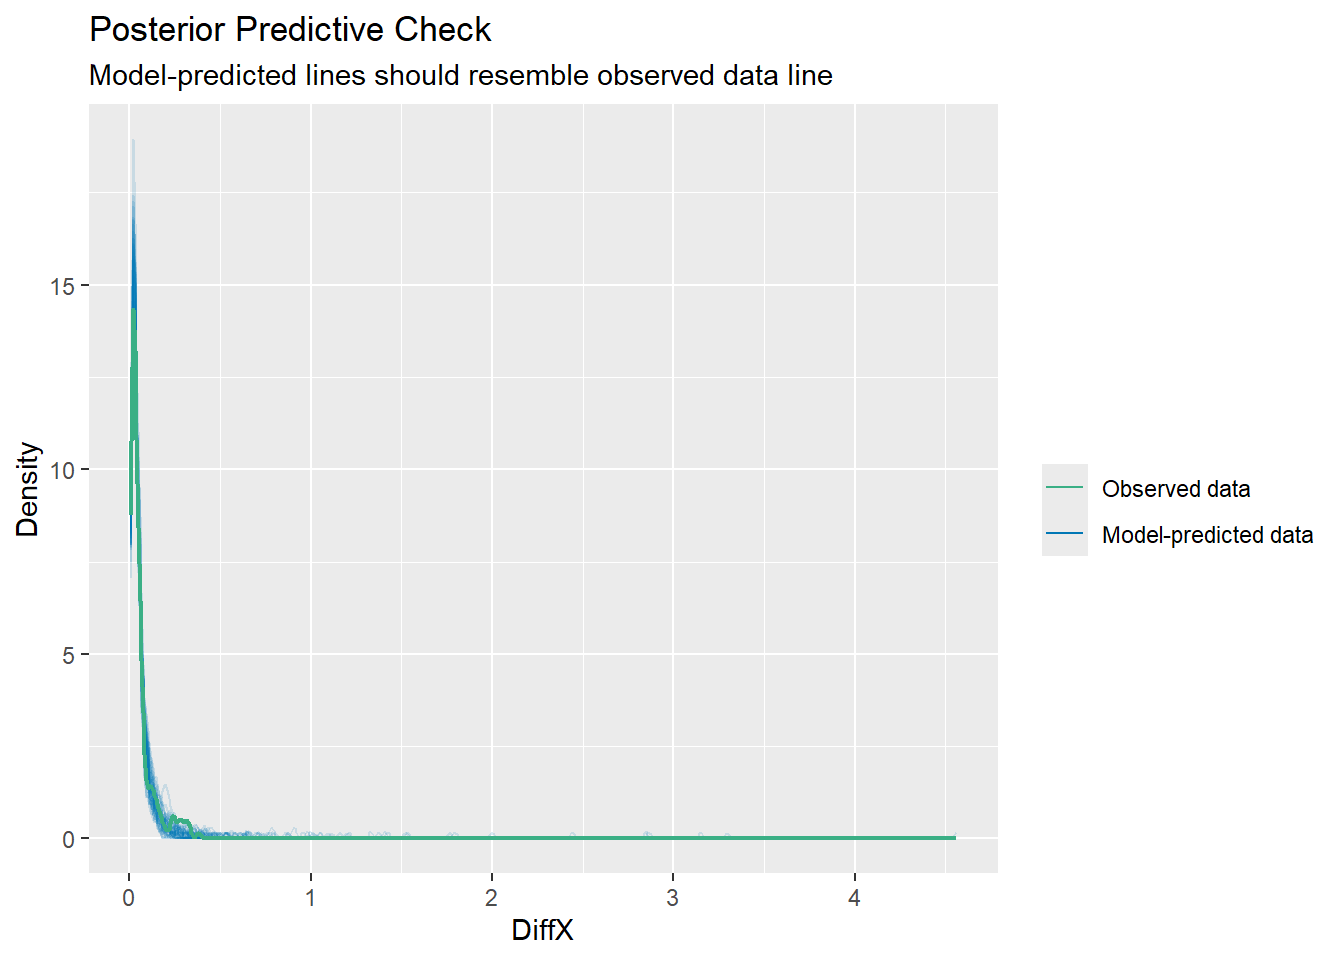
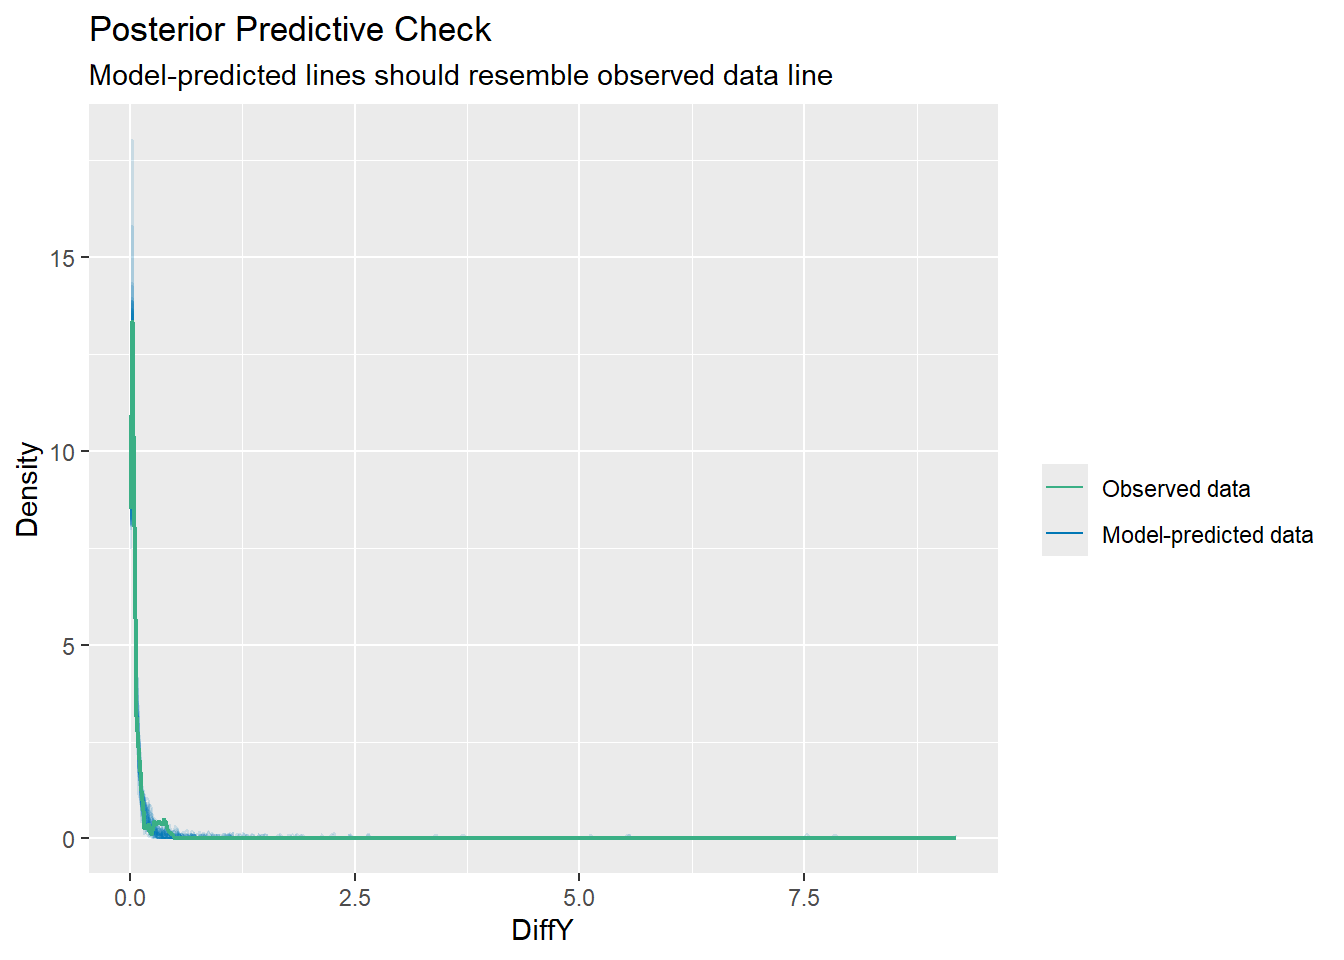
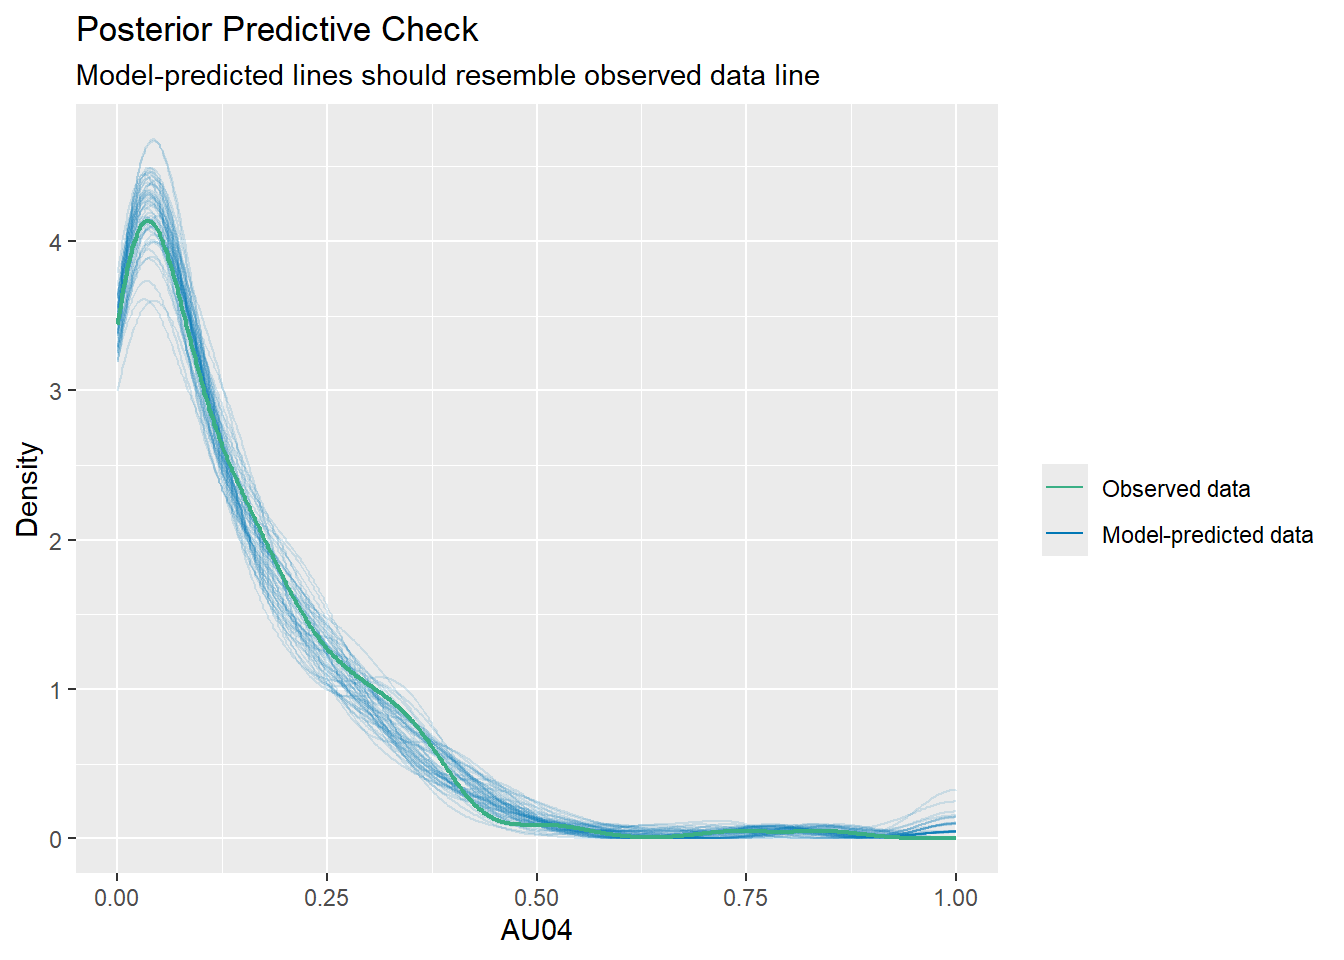
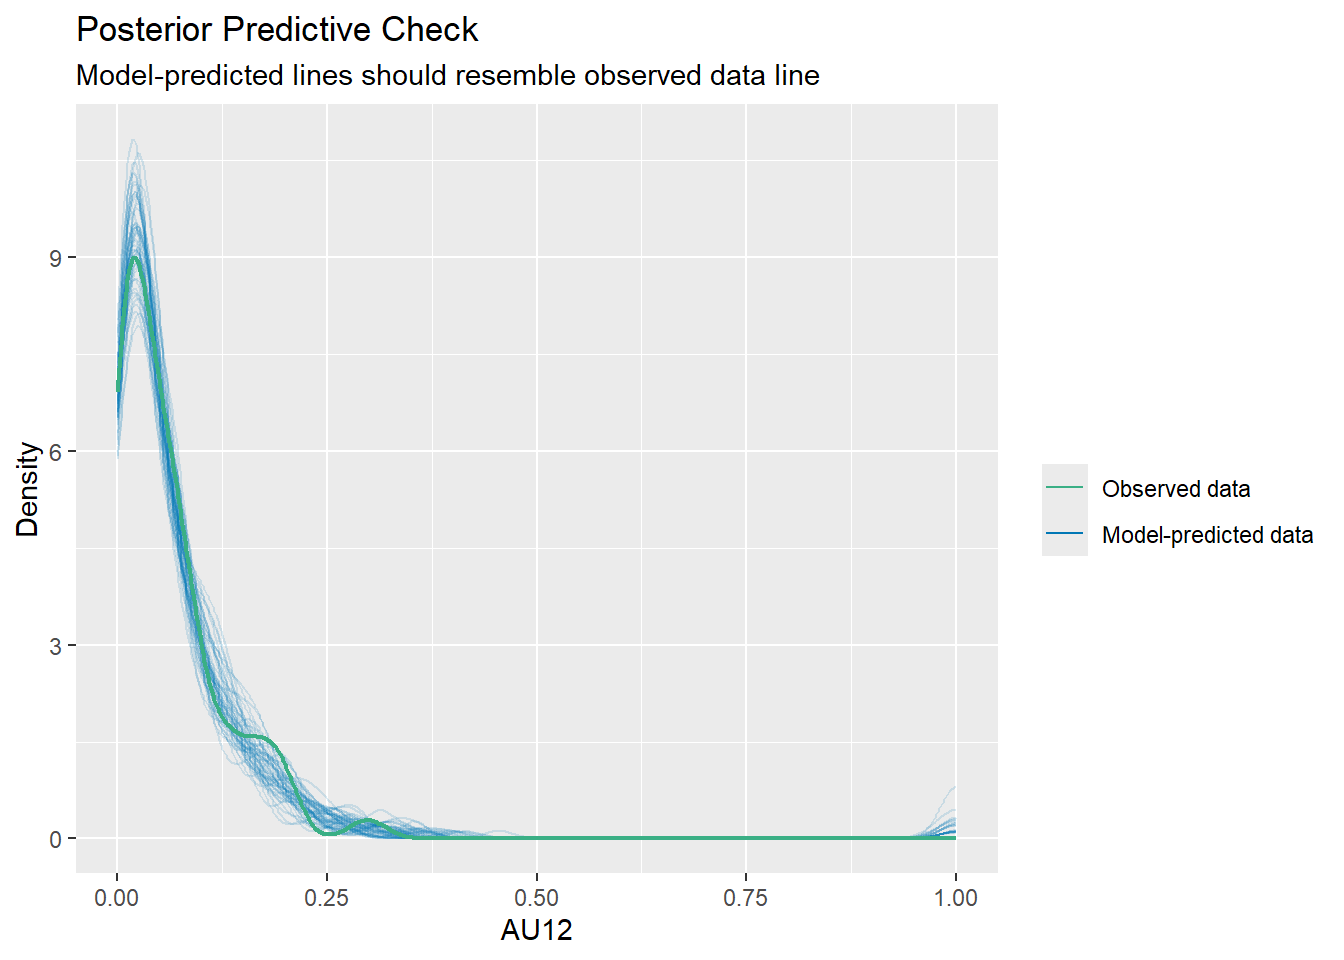
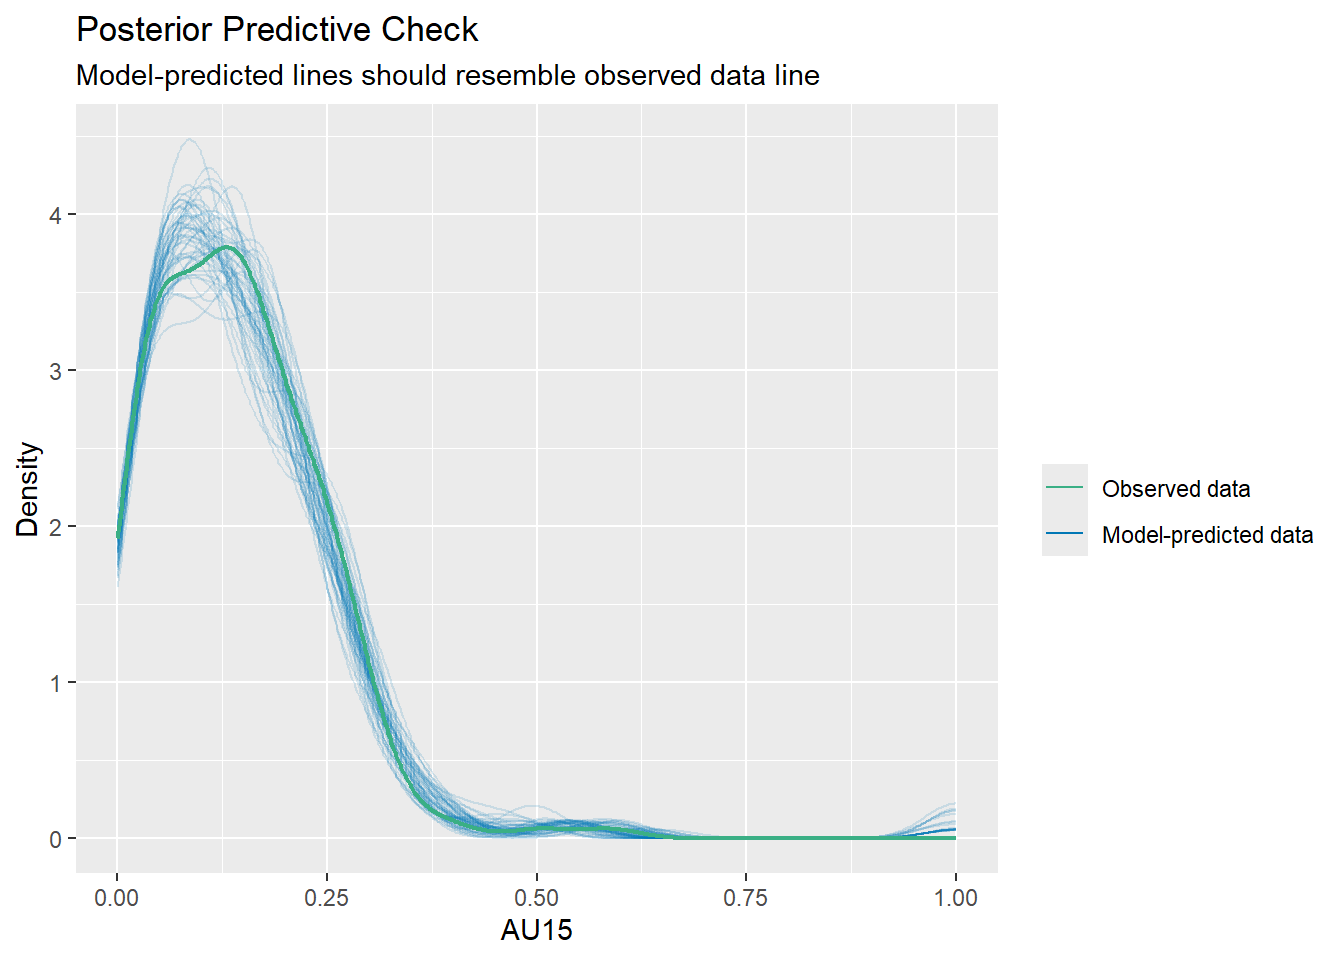
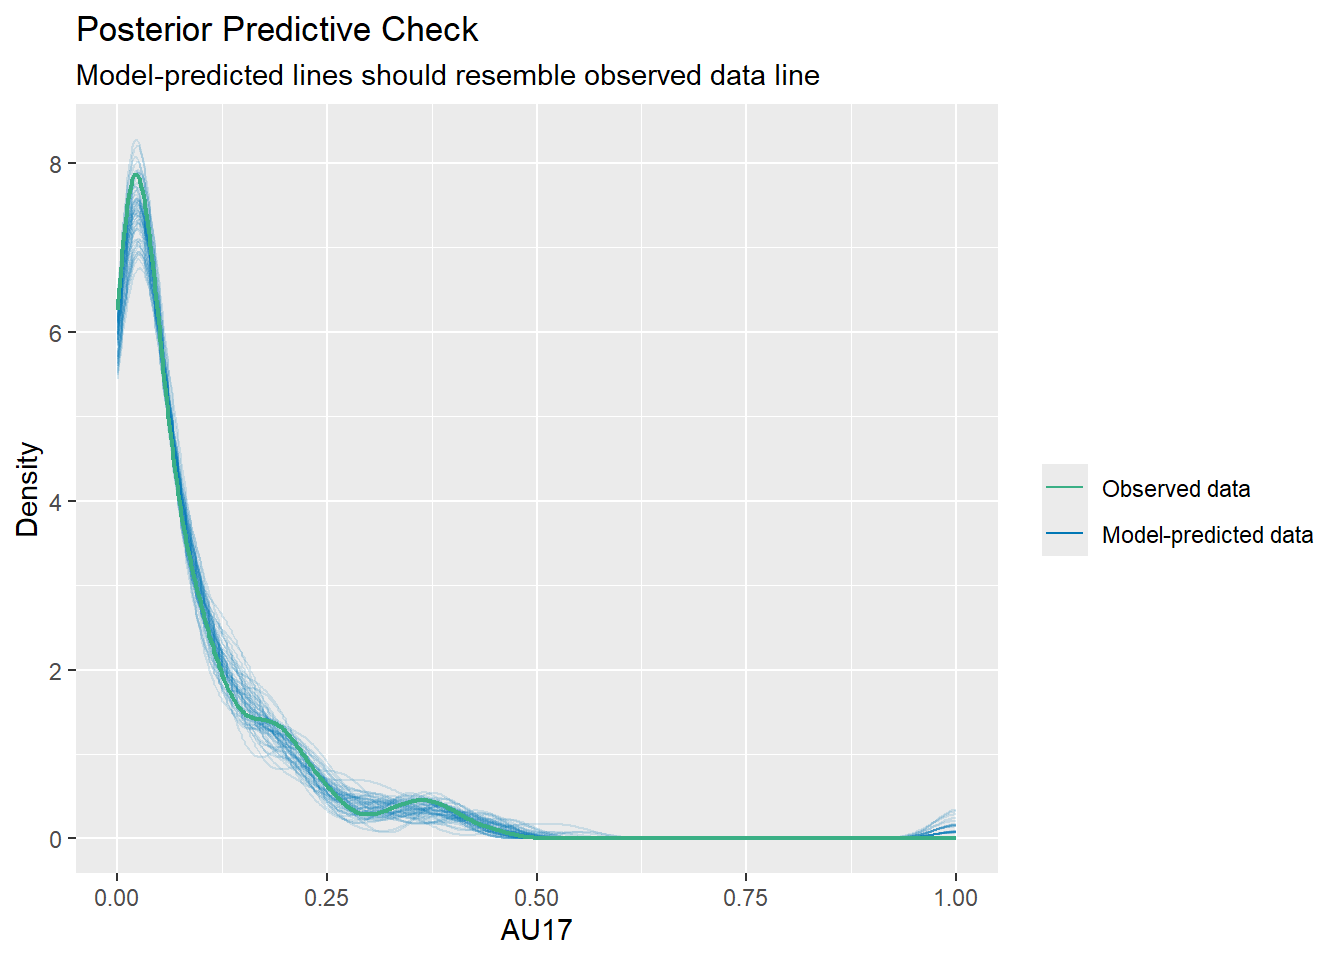
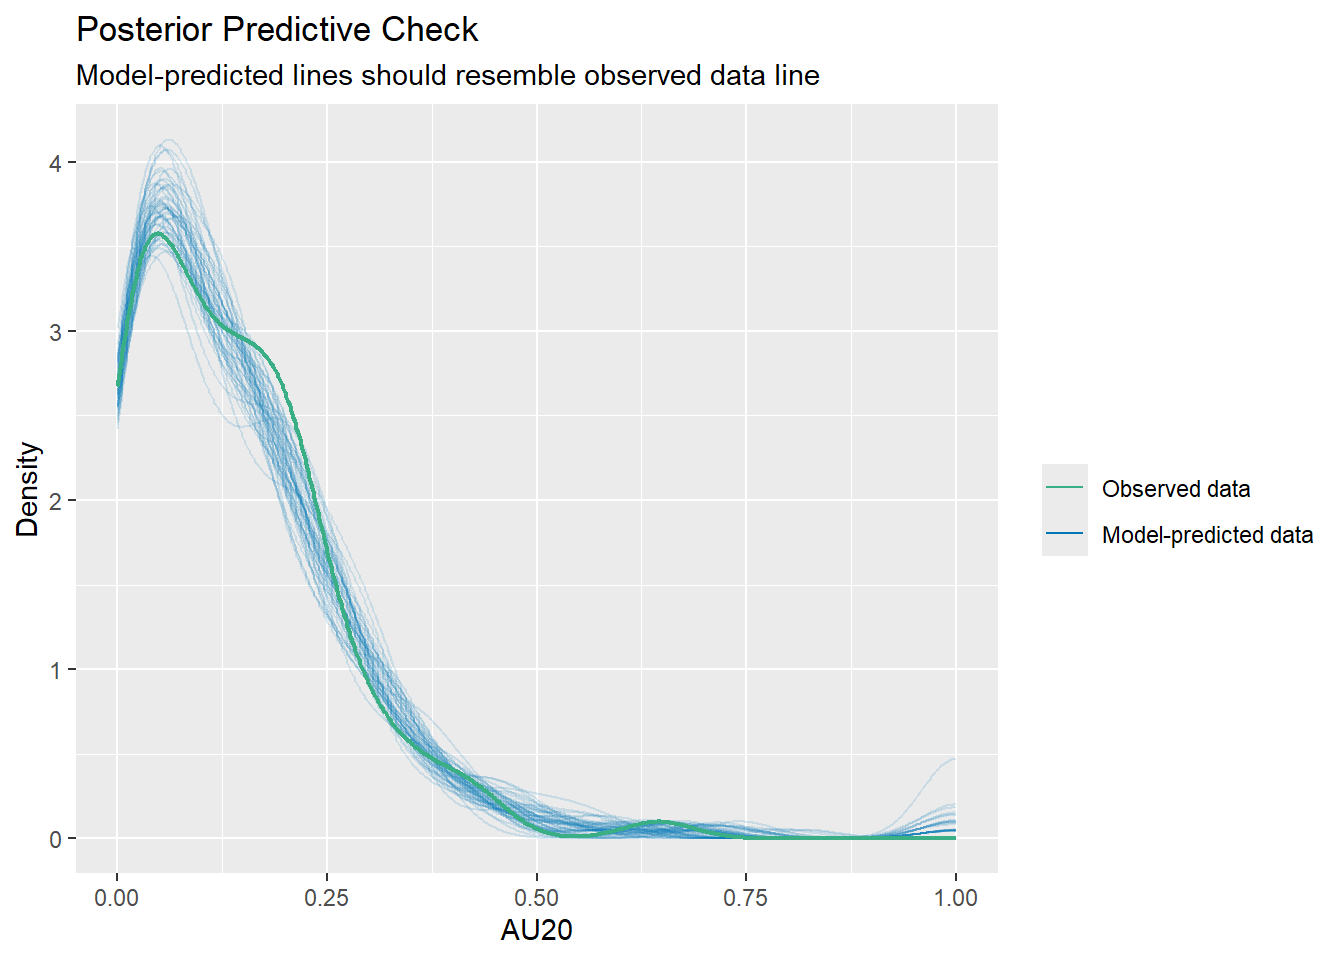
ggsave("visual.png", width = 6.5, height = 6.5, units = "in", dpi = 600, device = ragg::agg_png, bg = "white")walk(all_models, \(x) print(check_predictions(x, type = "density", allow_new_levels = TRUE)))