```{r}
#| label: fig-cars
#| fig-cap: "Stopping distance by speed."
#| classes: wrap-right
#| out-width: "40%"
plot(cars, pch = 19, col = "#3b6ea8",
     xlab = "Speed (mph)", ylab = "Stopping distance (ft)")
```
A code cell makes a figure when it has a fig- label and a fig-cap. The class goes in #| classes:, and the width in #| out-width:. This page shows the cell with its options:
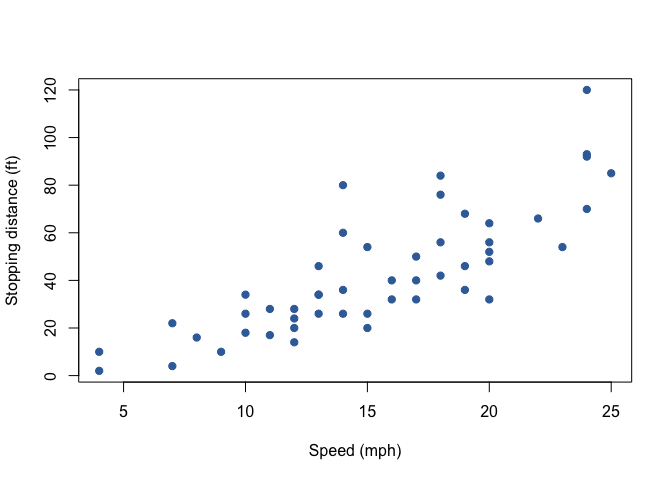
The data are the cars data set that ships with R: the speed of each car and the distance that it took to stop. This paragraph comes before the cell, so it runs the full width of the text.
```{r}
#| label: fig-cars
#| fig-cap: "Stopping distance by speed."
#| classes: wrap-right
#| out-width: "40%"
plot(cars, pch = 19, col = "#3b6ea8",
xlab = "Speed (mph)", ylab = "Stopping distance (ft)")
```Figure 1 comes from the R code above. The cell’s code stays above the figure, and the figure floats to the right of the paragraphs after the cell.
Faster cars took longer to stop. The figure has the same caption, number, and @fig- link as a figure written in markdown. The plot’s size in R sets its shape, and out-width scales it to 40% of the text width. The site renders this page from results that Quarto saved when the cell last ran, so the site does not need R to build it. The cell’s options start with #|, and knitr reads them before it runs the code. The last lines of this paragraph start at the left edge of the text again and run under the figure. Two columns or a table could not give this layout, because the text in them stays in its own column from top to bottom.
A heading is not a paragraph, so wrapping stops before it.