
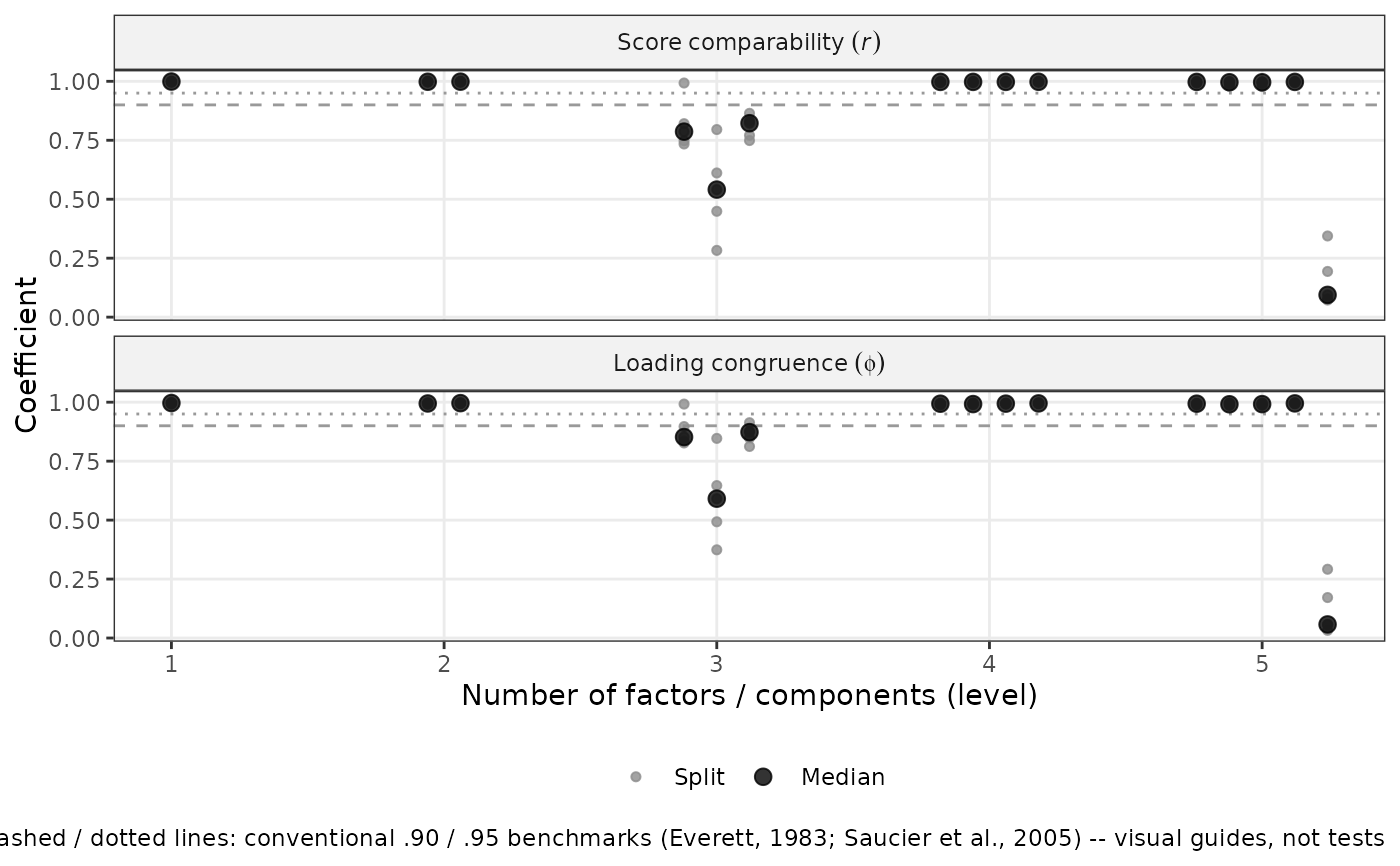
Renders a two-panel ggplot2 diagnostic for a comparability() object. The
panels show score comparability (r) and loading congruence (Tucker's phi)
for every factor at every level. A factor is a summary variable standing in
for a group of items that move together. A loading is the correlation
between an item and a factor, and congruence is a 0 to 1 index of how
similar two loading patterns are. Grey points are individual splits, and
black points are the per-factor medians. Dashed and dotted reference lines
mark the
conventional .90 and .95 benchmarks, which are visual guides, not tests.
Usage
# S3 method for class 'comparability'
autoplot(object, ...)Examples
# \donttest{
if (requireNamespace("ggplot2", quietly = TRUE)) {
cmp <- comparability(sim16, k_max = 5, n_splits = 5, seed = 1)
autoplot(cmp)
}
#> ℹ Fitting 5 split-half replicates (pca, k = 1-5)...
#> ✔ Fitting 5 split-half replicates (pca, k = 1-5)... [138ms]
#>
 # }
# }