
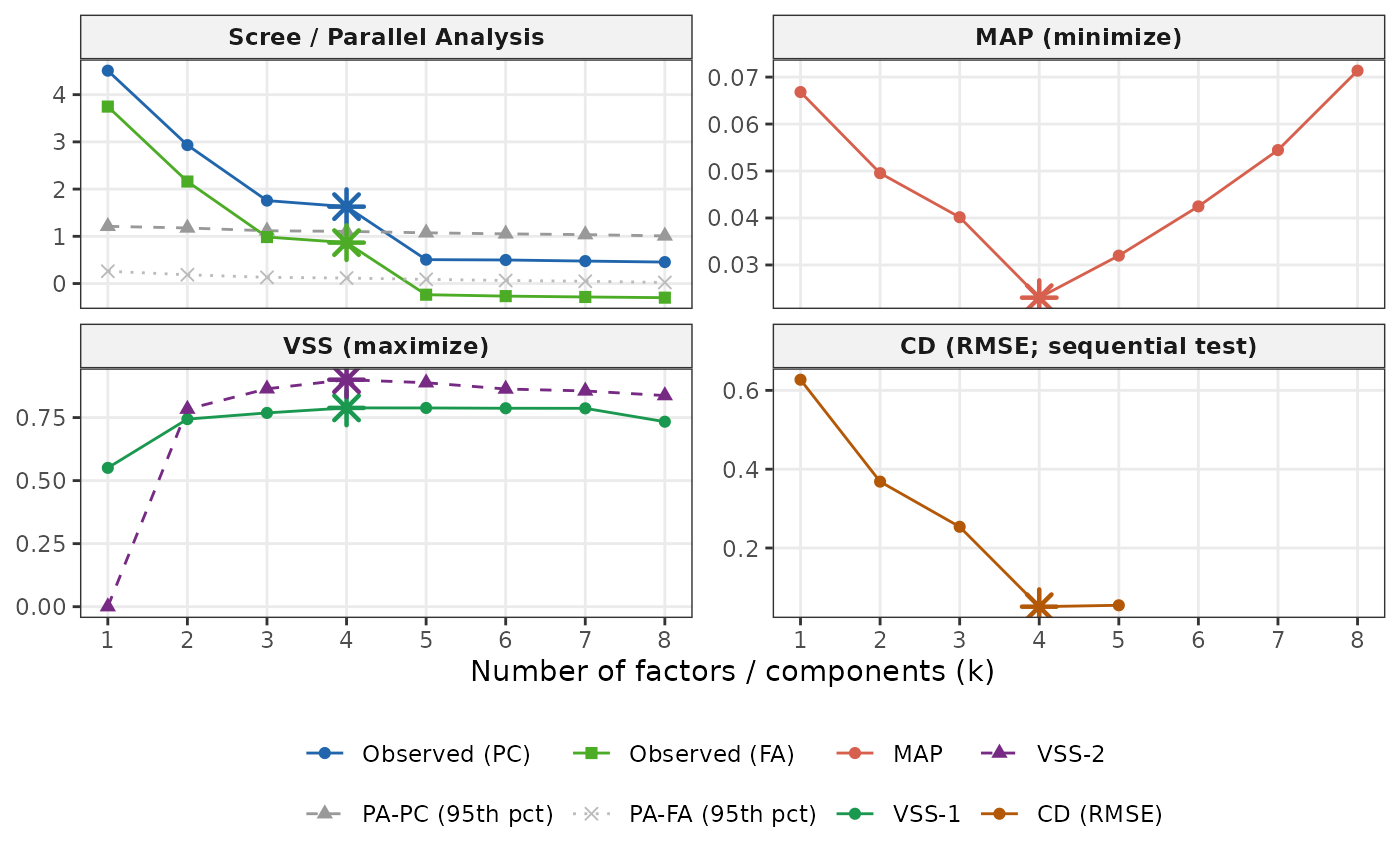
Renders a ggplot2 diagnostic for a suggest_k object. The plot shows one
panel for each criterion group that was requested. The groups are Scree/PA
(if "pa_pc" or "pa_fa" were requested), MAP (if "map"), VSS (if
"vss"), and CD RMSE (if "cd" and EFAtools was available). PA is
parallel analysis, which compares the eigenvalues of your data with those
of random data of the same shape. When four panels are shown the
layout is a 2x2 grid, and otherwise a single-column layout is used. The
recommended k for each criterion is marked with a star-shaped point.
Usage
# S3 method for class 'suggest_k'
autoplot(object, ...)Details
The scree panel shows both PC and FA observed eigenvalues alongside their respective random-data thresholds (for whichever PA bases were requested). PA-PC compares the blue "Observed (PC)" line to the dashed PA-PC threshold, and PA-FA compares the teal "Observed (FA)" line to the dotted PA-FA threshold.
The CD panel plots the mean RMSE between observed and comparison-data eigenvalues at each k. CD uses a sequential one-sided Wilcoxon test (Ruscio & Roche, 2012). A factor is a summary variable standing in for a group of items that move together. CD retains a factor while adding it significantly reduces RMSE (default \(\alpha = 0.30\)), and the starred k is the last retained factor. The curve is shown only over the levels that were actually computed. The starred k need not be the visible minimum of the plotted curve.
Requires the ggplot2 package.
Examples
# \donttest{
if (requireNamespace("ggplot2", quietly = TRUE)) {
sk <- suggest_k(sim16, n_iter = 5)
autoplot(sk)
}
#> ℹ Running parallel analysis (5 iterations, PC + FA)...
#> ✔ Running parallel analysis (5 iterations, PC + FA)... [50ms]
#>
#> ℹ Running MAP and VSS...
#> ✔ Running MAP and VSS... [91ms]
#>
#> ℹ Running Comparison Data (CD)...
#> ✔ Running Comparison Data (CD)... [2.2s]
#>
 # }
# }