| Abbrev | Film | Clip Start | Clip Stop | Duration |
|---|---|---|---|---|
| DaysSummer | 500 Days of Summer (2009) | 01:24:27.000 | 01:26:39.000 | 132 |
500 Days of Summer
Film Information
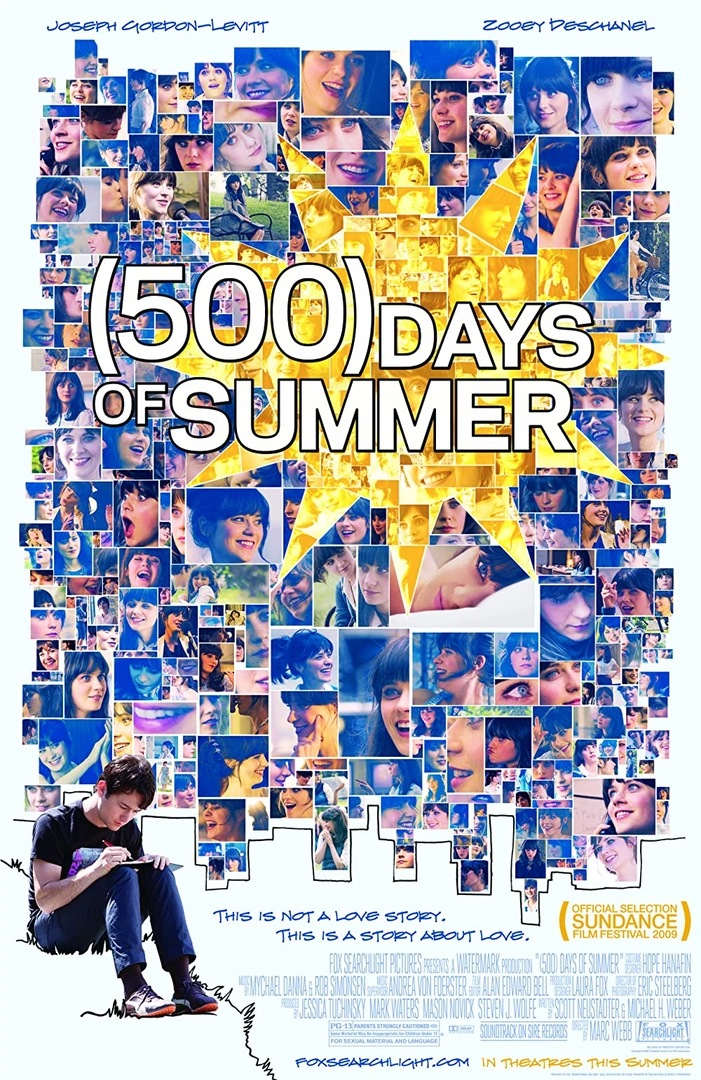
500 Days of Summer is a 2009 American romantic comedy-drama film directed by Marc Webb from a screenplay written by Scott Neustadter and Michael H. Weber, and produced by Mark Waters. The film stars Joseph Gordon-Levitt and Zooey Deschanel and employs a nonlinear narrative structure, with the story based upon its male protagonist and his memories of a failed relationship.
All information in this section came from Wikipedia.
Clip Information
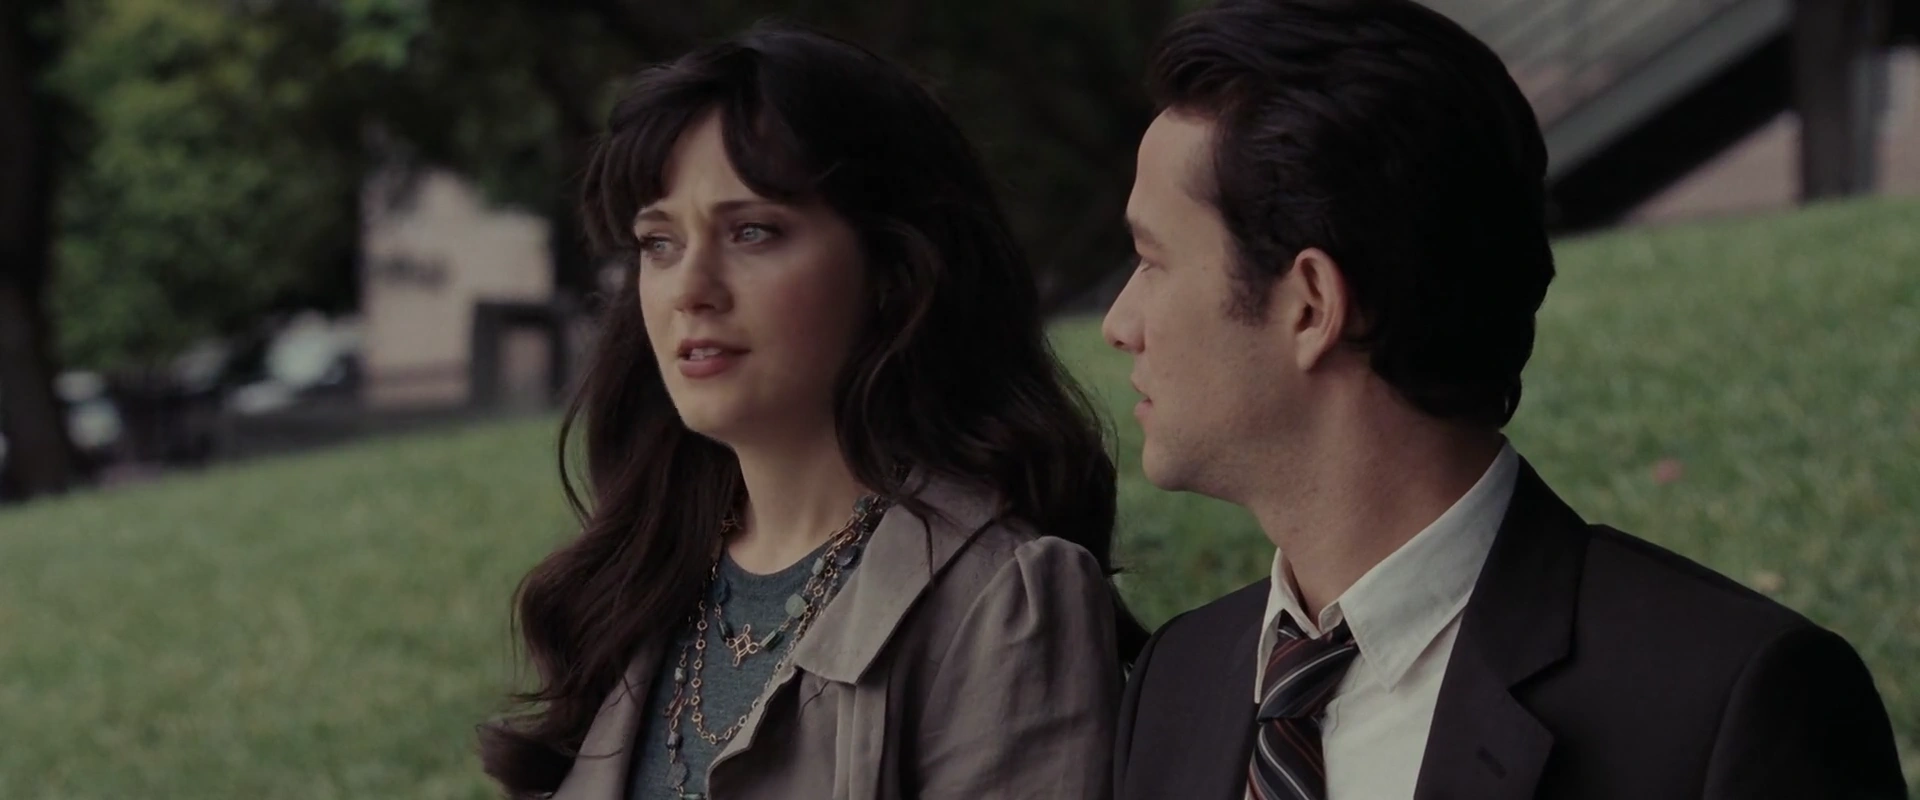
Summer and Tom are sitting on a bench, catching up on each other’s lives. They used to be in a romantic relationship, but Summer is now married to another man.
| Characteristic | Value |
|---|---|
| Format | MPEG-4 |
| File Size | 30.4 MiB |
| Duration | 132.007 |
| Frame Rate | 23.976 |
| Video Width | 1920 |
| Video Height | 800 |
| Video BitRate | 1.6 MB/s |
| Audio Channels | 6 |
| Audio SamplingRate | 48000 |
| Audio BitRate | 341.2 kB/s |


Subtitles
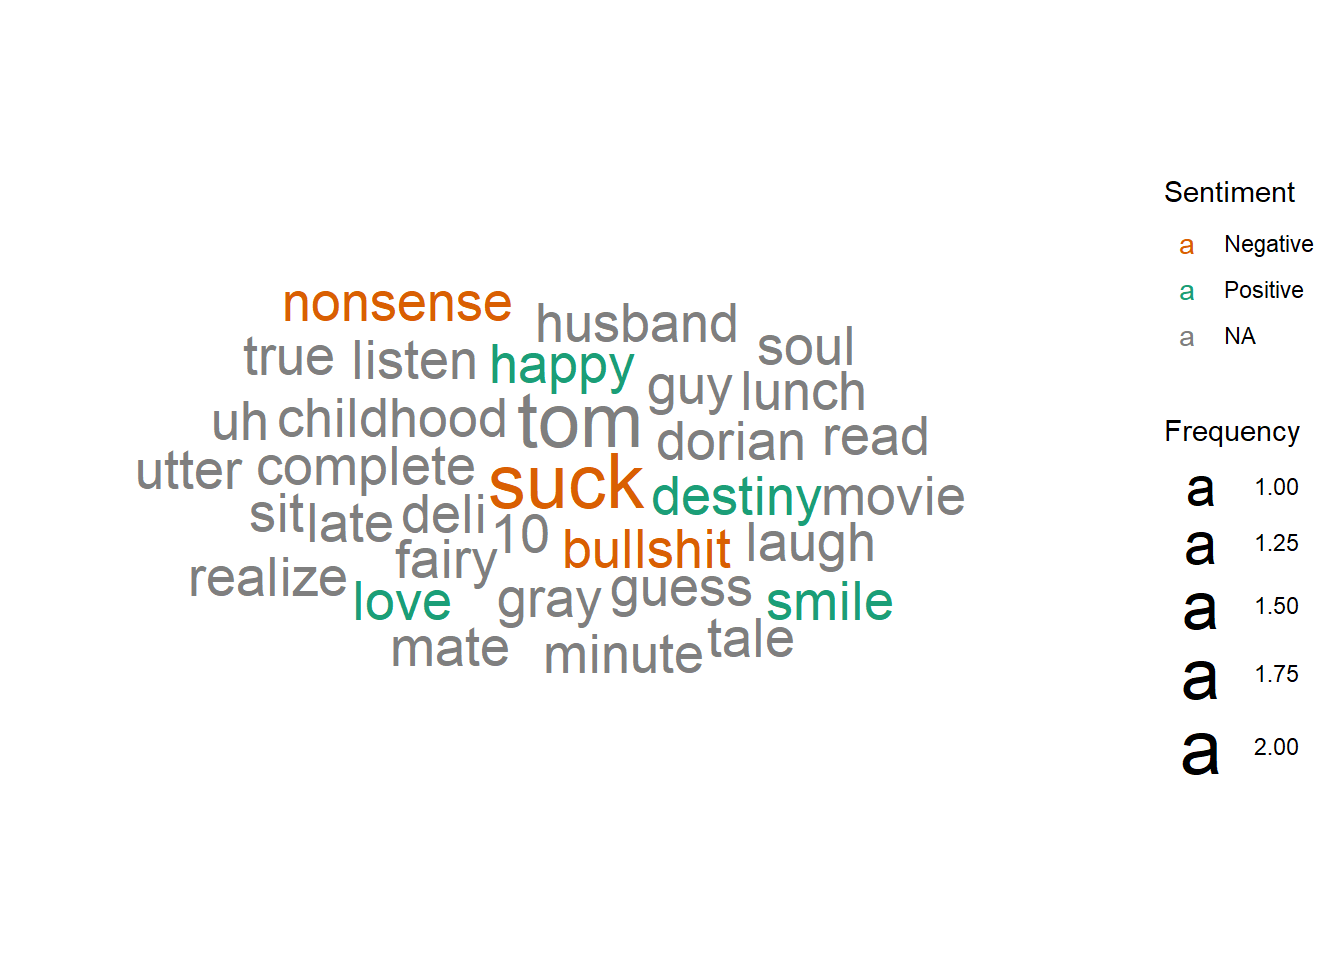
The following wordcloud shows the words used in this clip, scaled by number of occurrences and colored by sentiment (orange = negative, green = positive, grey = neutral or unsure). Note that the words have been stemmed and lemmatized and stopwords have been removed.
The table below shows all subtitles in this clip with the start and stop time of each subtitle’s appearance in seconds.
| Start | End | Subtitle |
|---|---|---|
| 6.00 | 7.980 | You know what sucks? |
| 8.08 | 11.420 | Realizing that everything you believe in is complete and utter bullshit. |
| 11.52 | 13.511 | - It sucks. - What do you mean? |
| 13.64 | 17.580 | Uh, you know, destiny, and soul mates, and true love, |
| 17.68 | 22.310 | and all that childhood fairy tale nonsense. |
| 22.44 | 24.715 | You were right. I-I should have listened to you. |
| 24.84 | 25.640 | No. |
| 25.84 | 28.310 | Yeah. What? What are you smiling at? |
| 29.52 | 31.954 | - Tom. - What? |
| 33.64 | 36.380 | What are you looking at me like that for? |
| 36.48 | 39.100 | Well, you know, |
| 39.20 | 41.380 | I guess it's 'cause... |
| 41.48 | 44.020 | I was sitting in a deli and reading Dorian Gray |
| 44.12 | 46.580 | and... a guy comes up to me... |
| 46.68 | 49.260 | and asked me about it, |
| 49.36 | 52.352 | and... now he's my husband. |
| 55.20 | 57.660 | Yeah. And... so? |
| 57.76 | 61.620 | So, what if I'd gone to the movies? |
| 61.72 | 66.620 | What if I had gone somewhere else for lunch? |
| 66.72 | 70.030 | What if I'd gotten there 10 minutes later? |
| 71.56 | 73.620 | It was- |
| 73.72 | 76.029 | It was meant to be. |
| 76.16 | 78.799 | And I just kept thinking, |
| 80.56 | 82.540 | - Tom was right. - No. |
| 82.64 | 84.700 | Yeah, I did. |
| 84.80 | 87.314 | [Laughs] I did. |
| 93.96 | 96.520 | It just wasn't me that you were right about. |
| 123.12 | 125.020 | I should go. |
| 125.12 | 128.112 | But I'm really happy to see that you're doing well. |
Holistic Ratings
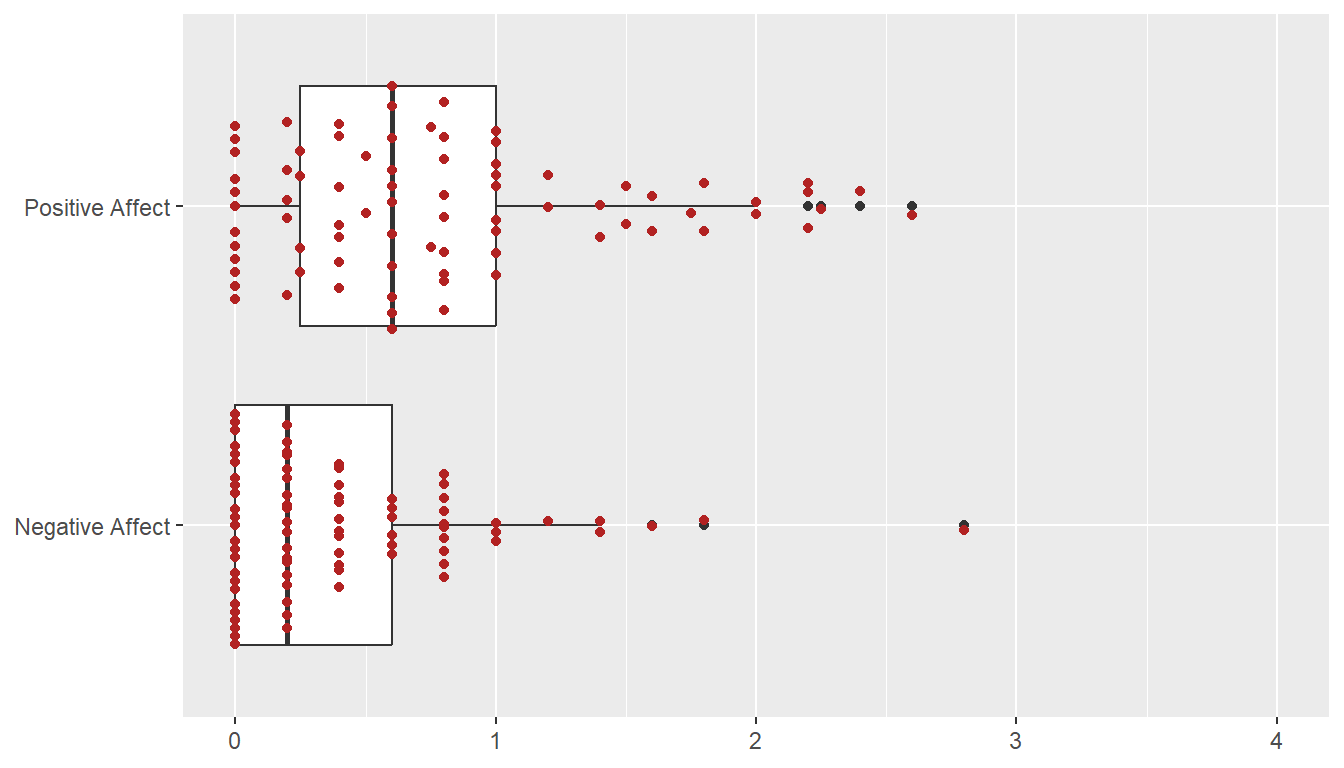
A total of 80 participants watched this film clip and then provided holistic ratings on how the entire clip made them feel. These holistic ratings were completed using five Positive Affect items (i.e., alert, determined, enthusiastic, excited, inspired) and five Negative Affect items (i.e., afraid, distressed, nervous, scared, upset), each rated on an ordinal scale from 0 to 4. The plot below shows the
Dynamic Ratings
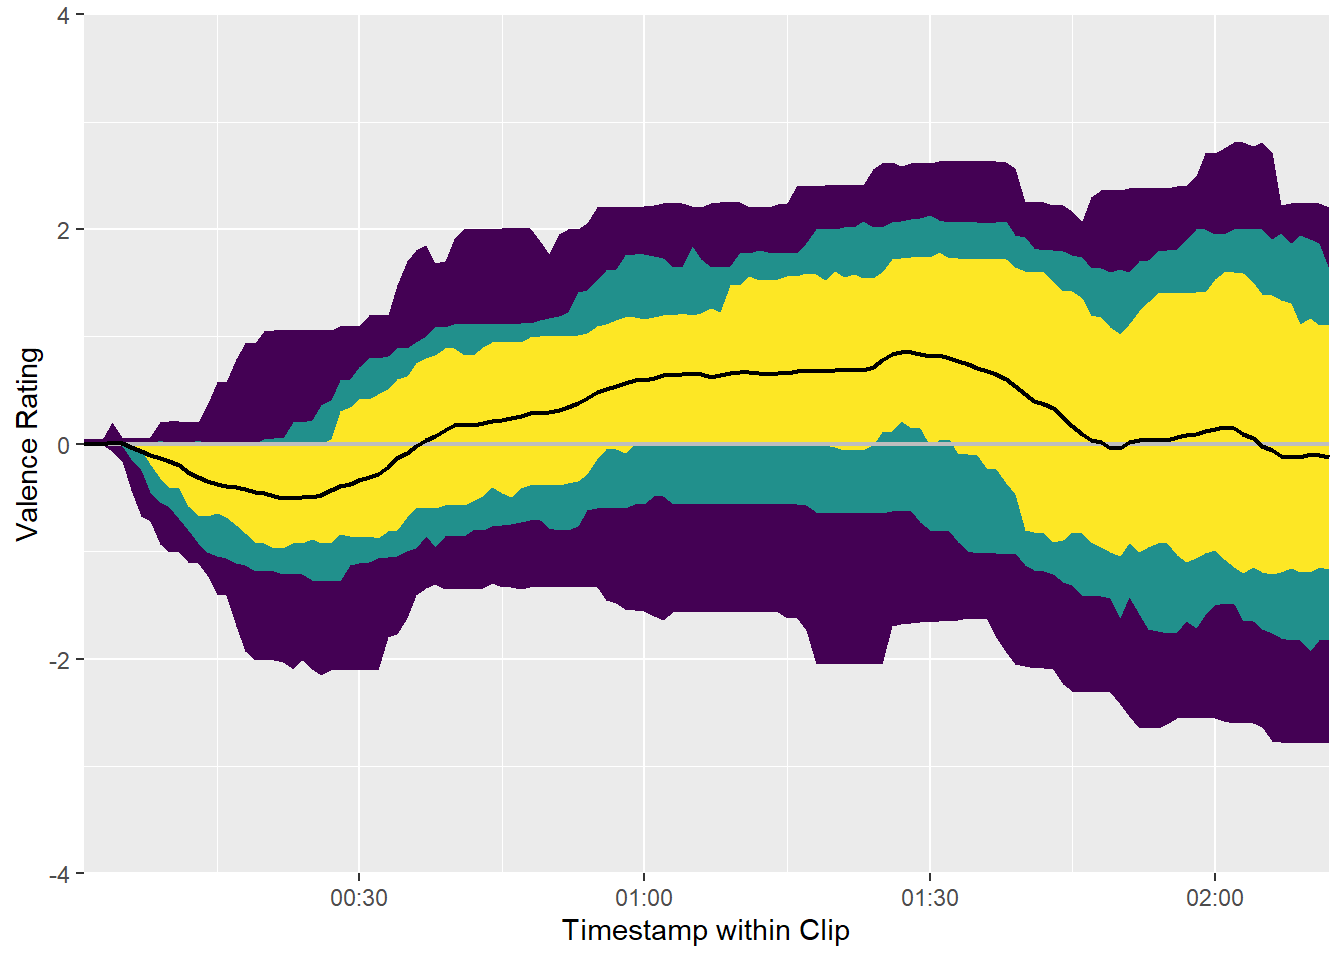
A total of 80 participants watched this film clip and used the CARMA software to provide continuous (i.e., second-by-second) ratings of how it made them feel. These continuous ratings were made on a single emotional valence scale ranging from -4 (very negative) to 4 (very positive).
Time Series
We can plot the distribution of all valence ratings per second of the film clip to get a sense of how its emotional tone changes over time. The solid black line represents the mean of all ratings and the yellow, green, and purple ribbons represent the central 50%, 70%, and 90% of the ratings, respectively.
Inter-Rater Reliability
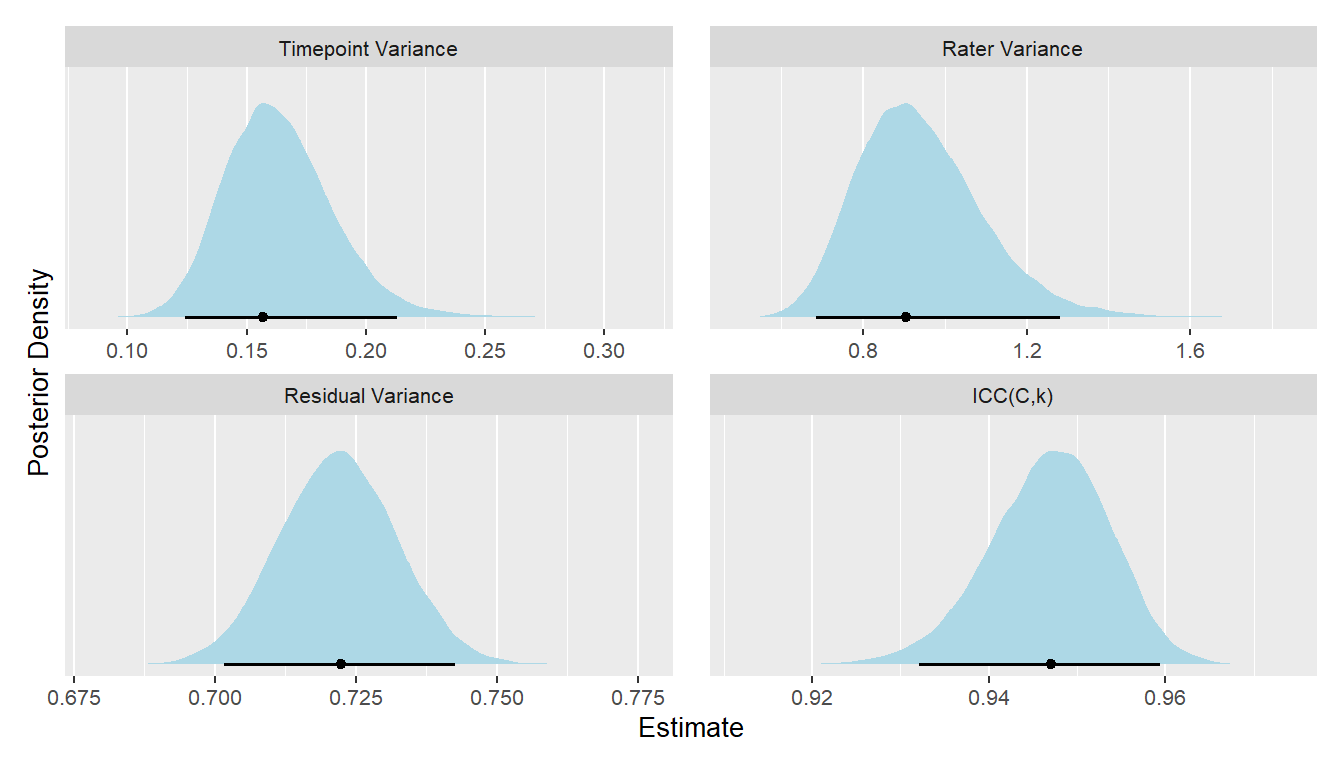
A Bayesian generalizability study was used to decompose the variance in ratings of this video clip into the following components: timepoint variance (in average ratings of each second, across raters), rater variance (in average ratings from each rater, across seconds), and residual variance (including second-by-rater interactions and measurement error). The lower and upper columns in the table below represent the boundaries of the 95% equal-tail credible interval. Note that we dropped the first 10 seconds of each clip (as rater “warmup” time).
| Component | Term | Estimate | Lower | Upper | Percent |
|---|---|---|---|---|---|
| Rater | Variance | 0.905 | 0.686 | 1.281 | 0.507 |
| Timepoint | Variance | 0.157 | 0.124 | 0.213 | 0.088 |
| Residual | Variance | 0.722 | 0.702 | 0.743 | 0.405 |
From these variance components, we can estimate inter-rater reliability of the ratings. There are many formulations of the two-way intraclass correlation (ICC), but the most relevant to our purposes here is the balanced average-measures consistency formulation or ICC(C,k).
| Term | Estimate | Lower | Upper | Raters | Error |
|---|---|---|---|---|---|
| ICC(C,k) | 0.947 | 0.932 | 0.959 | 80 | Relative |
Below, we can also visualize the posterior distributions of each of these parameters. Values with higher posterior density are more probable.