| Abbrev | Film | Clip Start | Clip Stop | Duration |
|---|---|---|---|---|
| Miracle | Miracle (2004) | 01:36:19.500 | 01:42:00.000 | 341 |
Miracle
Film Information
Miracle is a 2004 American sports film about the United States men’s ice hockey team, led by head coach Herb Brooks, portrayed by Kurt Russell, who won the gold medal in the 1980 Winter Olympics. The American team’s victory over the heavily favored Soviet professionals in the medal round was dubbed the “Miracle on Ice”. Miracle was directed by Gavin O’Connor and written by Eric Guggenheim and Mike Rich.
All information in this section came from Wikipedia.
Clip Information
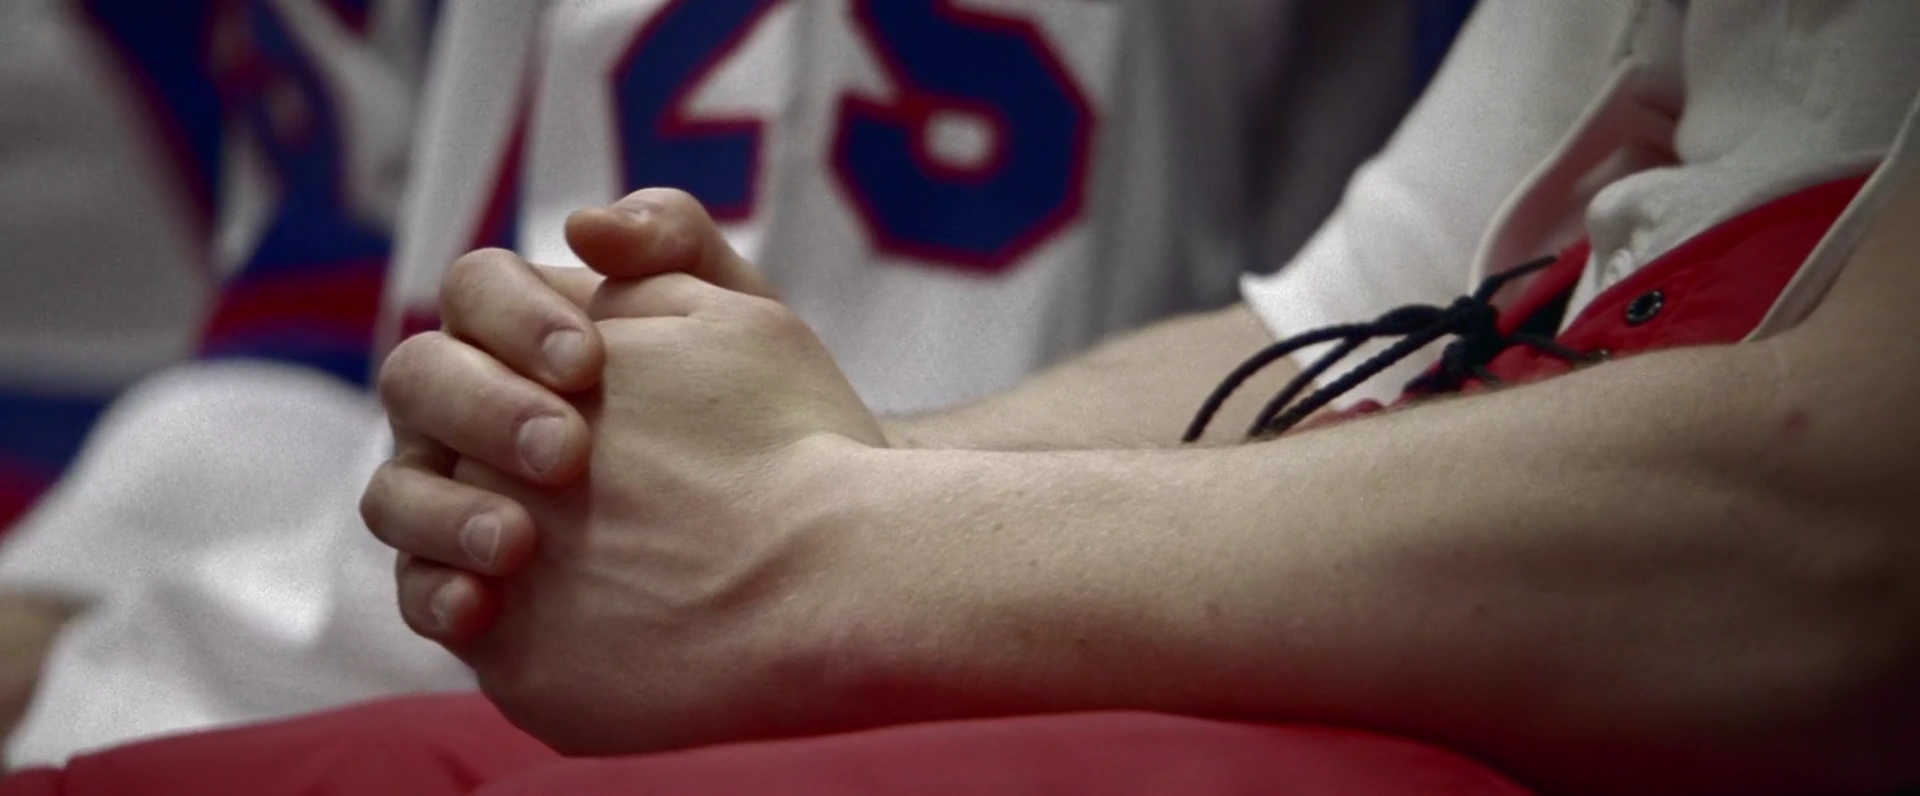
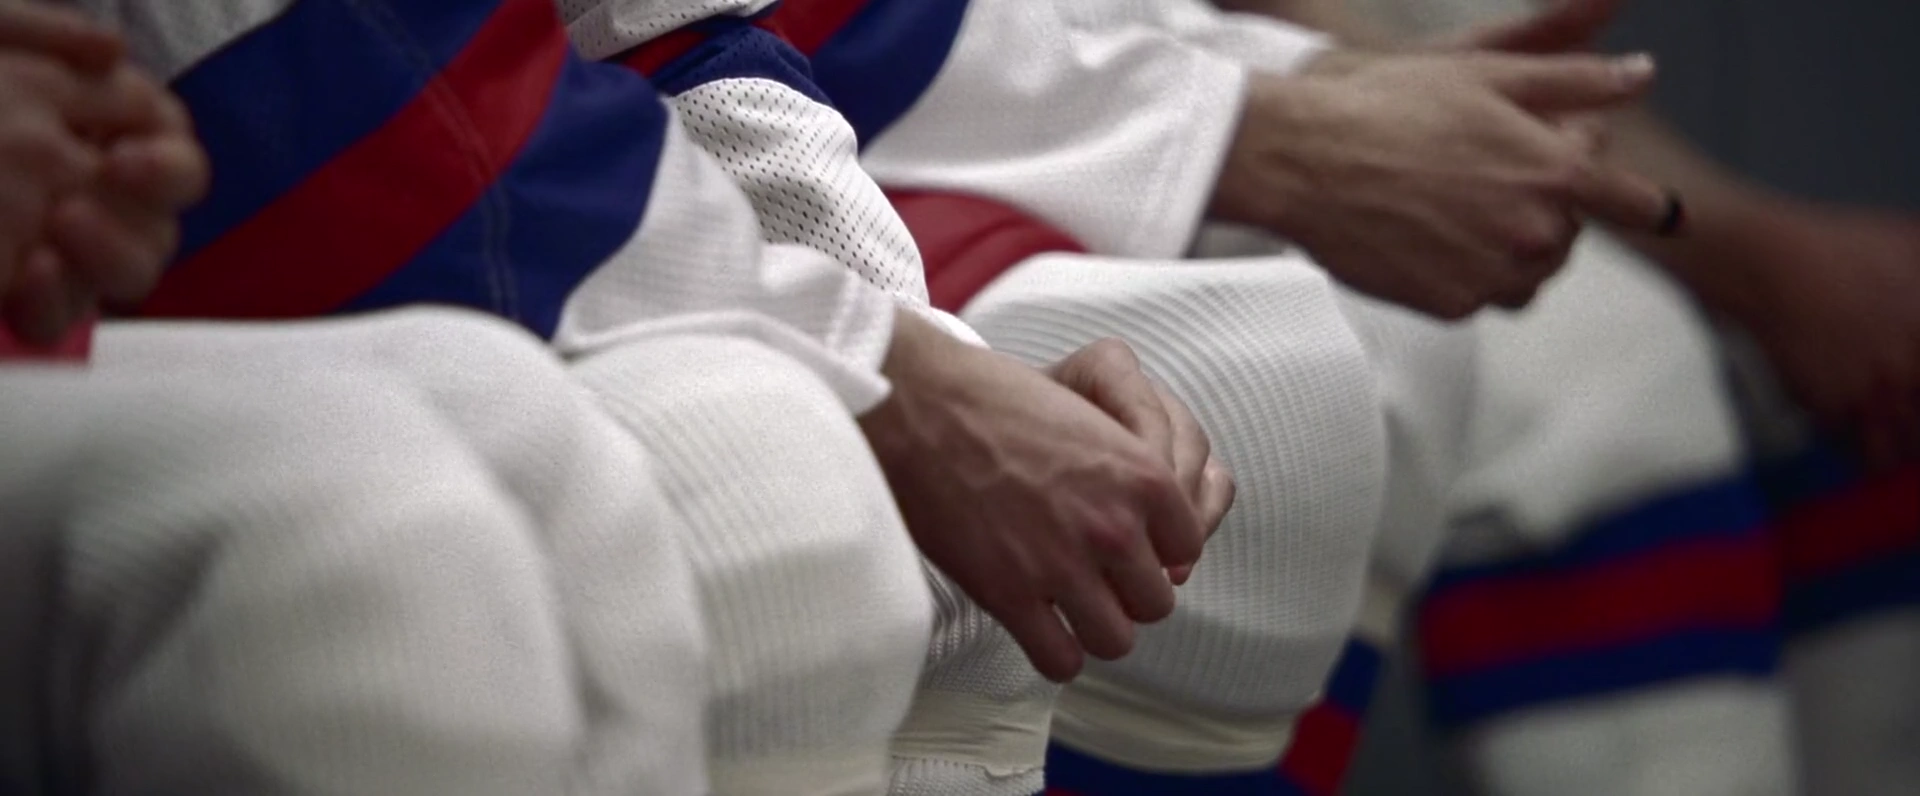
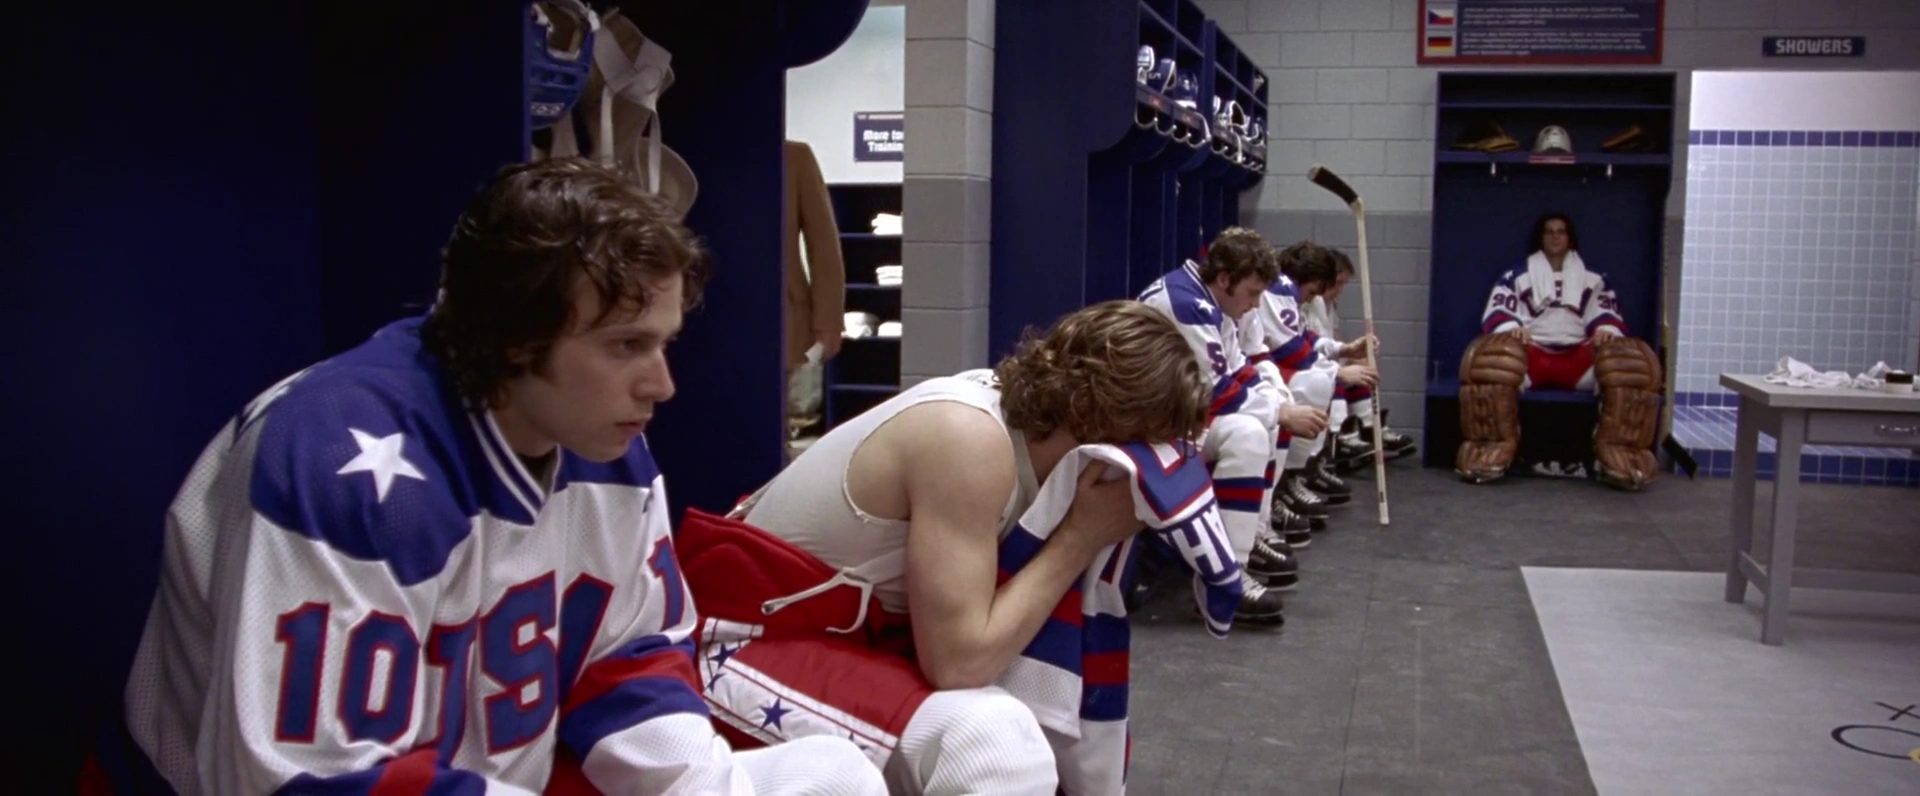
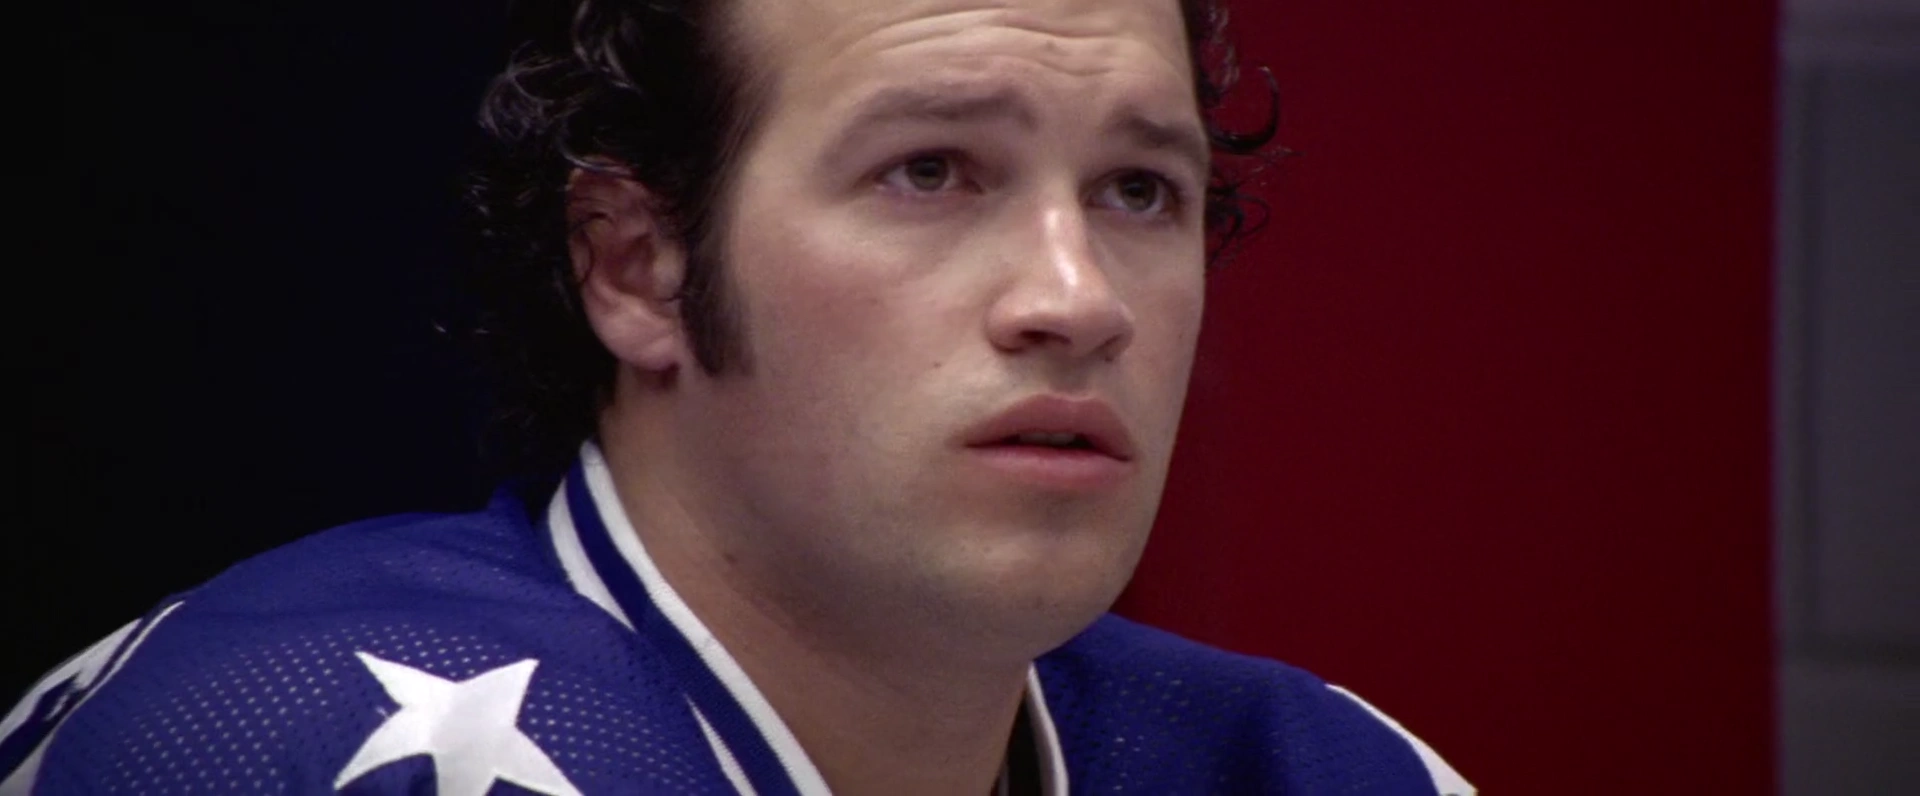
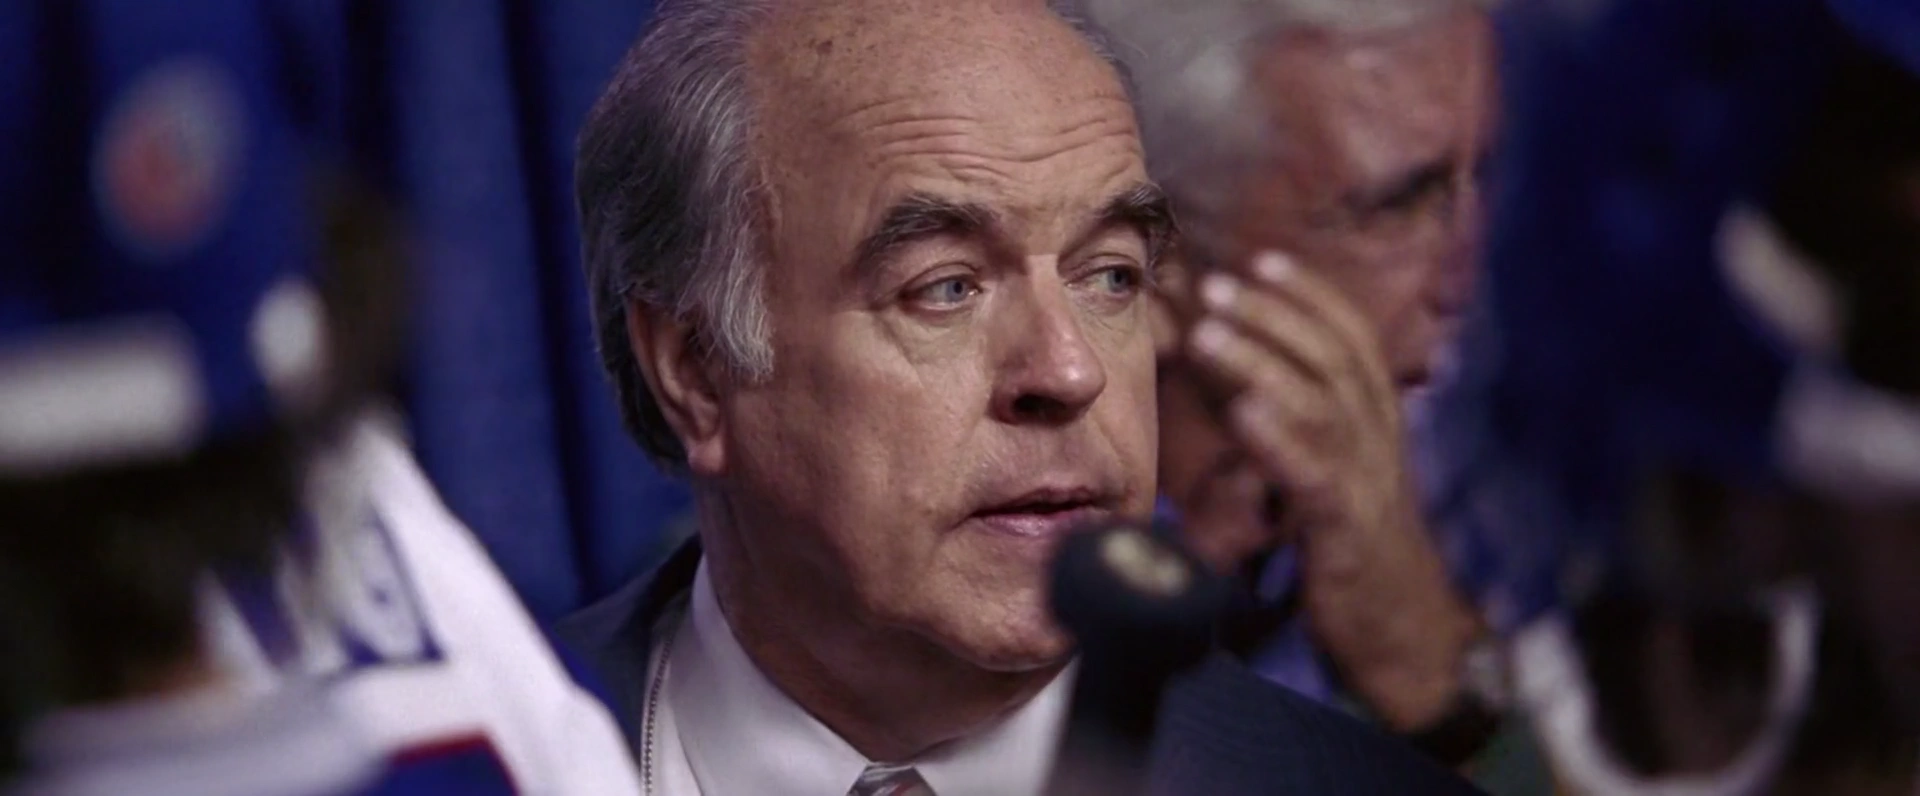
At the 1980 Winter Olympics, the United States men’s hockey team is getting ready to play their rival, the Soviet Union. Before the game, the head coach, Herb Brooks, talks to the team.
| Characteristic | Value |
|---|---|
| Format | MPEG-4 |
| File Size | 162.7 MiB |
| Duration | 341.008 |
| Frame Rate | 23.976 |
| Video Width | 1920 |
| Video Height | 796 |
| Video BitRate | 3.7 MB/s |
| Audio Channels | 6 |
| Audio SamplingRate | 48000 |
| Audio BitRate | 341.2 kB/s |


Subtitles
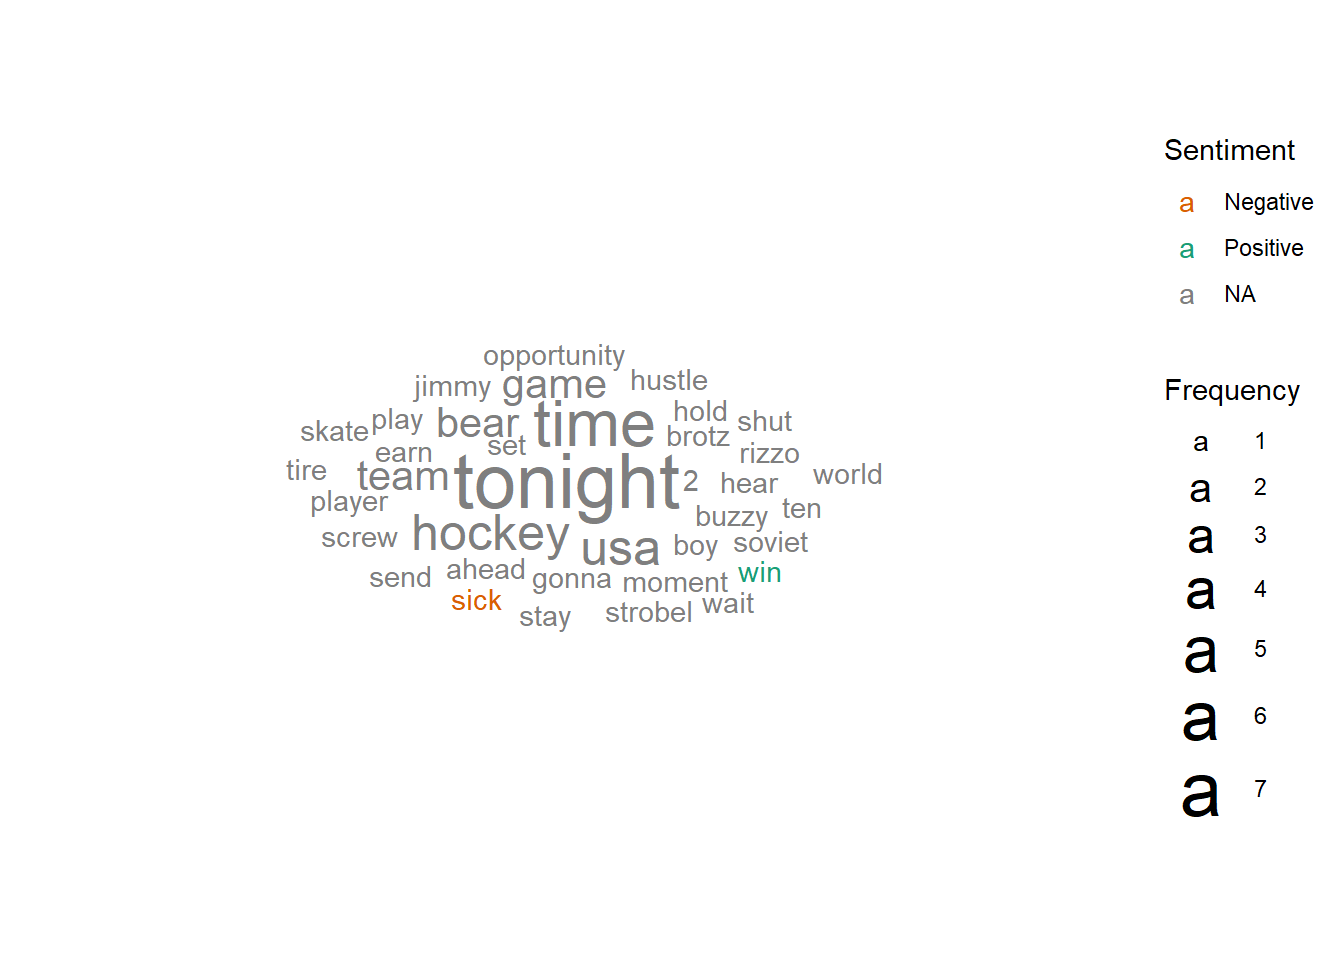
The following wordcloud shows the words used in this clip, scaled by number of occurrences and colored by sentiment (orange = negative, green = positive, grey = neutral or unsure). Note that the words have been stemmed and lemmatized and stopwords have been removed.
The table below shows all subtitles in this clip with the start and stop time of each subtitle’s appearance in seconds.
| Start | End | Subtitle |
|---|---|---|
| 120.310 | 122.395 | Great moments... |
| 124.064 | 126.982 | ...are born from great opportunity. |
| 129.152 | 131.654 | That's what you have here tonight, boys. |
| 133.990 | 137.618 | That's what you've earned here tonight. |
| 141.915 | 143.290 | One game. |
| 145.001 | 149.004 | If we played them ten times, they might win nine. |
| 150.882 | 152.883 | But not this game. |
| 154.302 | 155.970 | Not tonight. |
| 158.723 | 161.809 | Tonight we skate with them. |
| 163.270 | 166.105 | Tonight we stay with them. |
| 166.189 | 169.859 | And we shut them down because we can. |
| 175.824 | 181.412 | Tonight we are the greatest hockey team in the world. |
| 188.128 | 191.005 | You were born to be hockey players. |
| 192.007 | 194.008 | Every one of you. |
| 196.761 | 200.389 | And you were meant to be here tonight. |
| 204.978 | 207.146 | This is your time. |
| 211.318 | 214.445 | Their time is done. |
| 214.529 | 216.530 | It's over. |
| 217.574 | 223.579 | I'm sick and tired of hearing about what a great hockey team the Soviets have. |
| 223.663 | 227.541 | Screw them. This is your time. |
| 229.669 | 232.463 | Now, go out there and take it. |
| 308.290 | 311.333 | Hold up here a second. We're just gonna wait for the OK. |
| 313.420 | 316.505 | - We're all set. - All right. Go ahead and send them in. |
| 316.590 | 318.799 | OK. It's time. |
| 318.842 | 320.509 | Come on, Jimmy. |
| 320.594 | 324.805 | Come on, Buzzy. Let's hustle. |
| 328.476 | 330.519 | Come on, Brotz. Let's go, Strobel. |
| 333.189 | 334.857 | Rizzo. |
| 336.943 | 341.113 | USA! USA! USA! |
Holistic Ratings
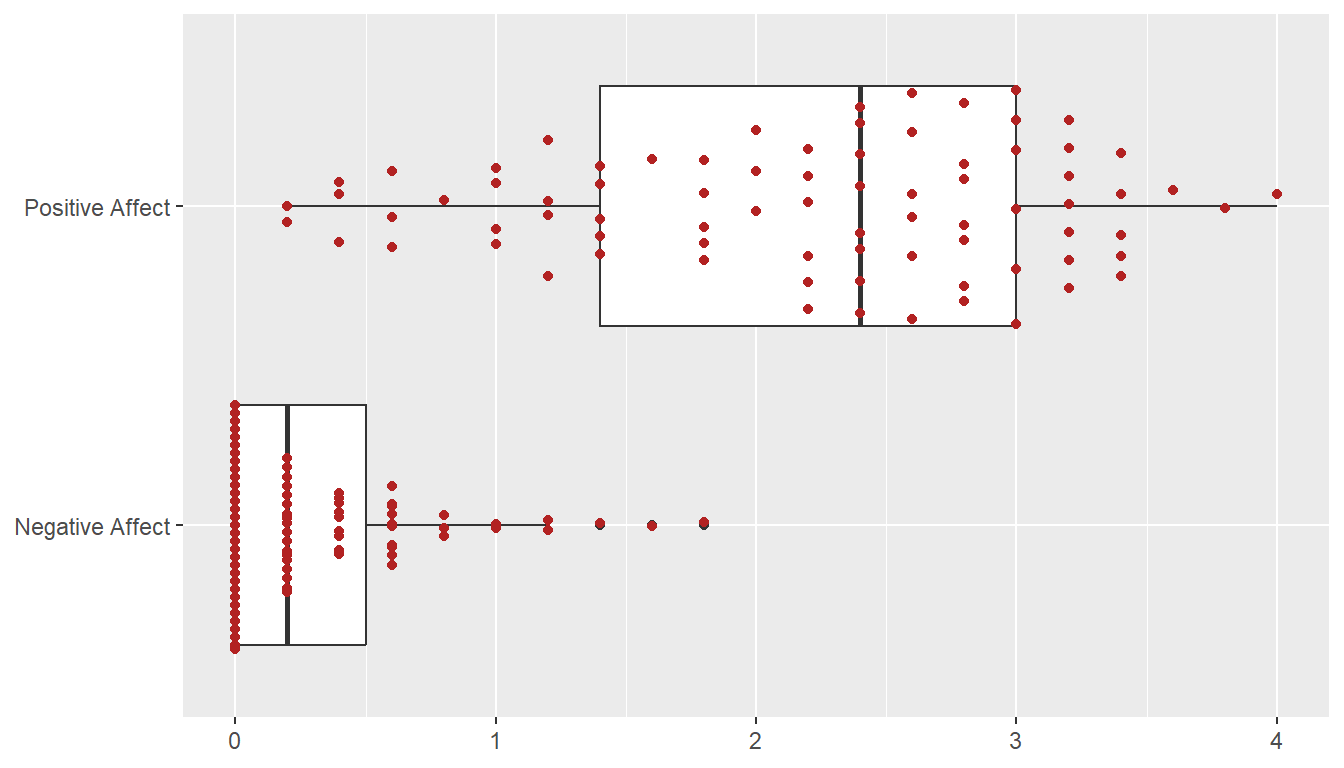
A total of 79 participants watched this film clip and then provided holistic ratings on how the entire clip made them feel. These holistic ratings were completed using five Positive Affect items (i.e., alert, determined, enthusiastic, excited, inspired) and five Negative Affect items (i.e., afraid, distressed, nervous, scared, upset), each rated on an ordinal scale from 0 to 4. The plot below shows the
Dynamic Ratings
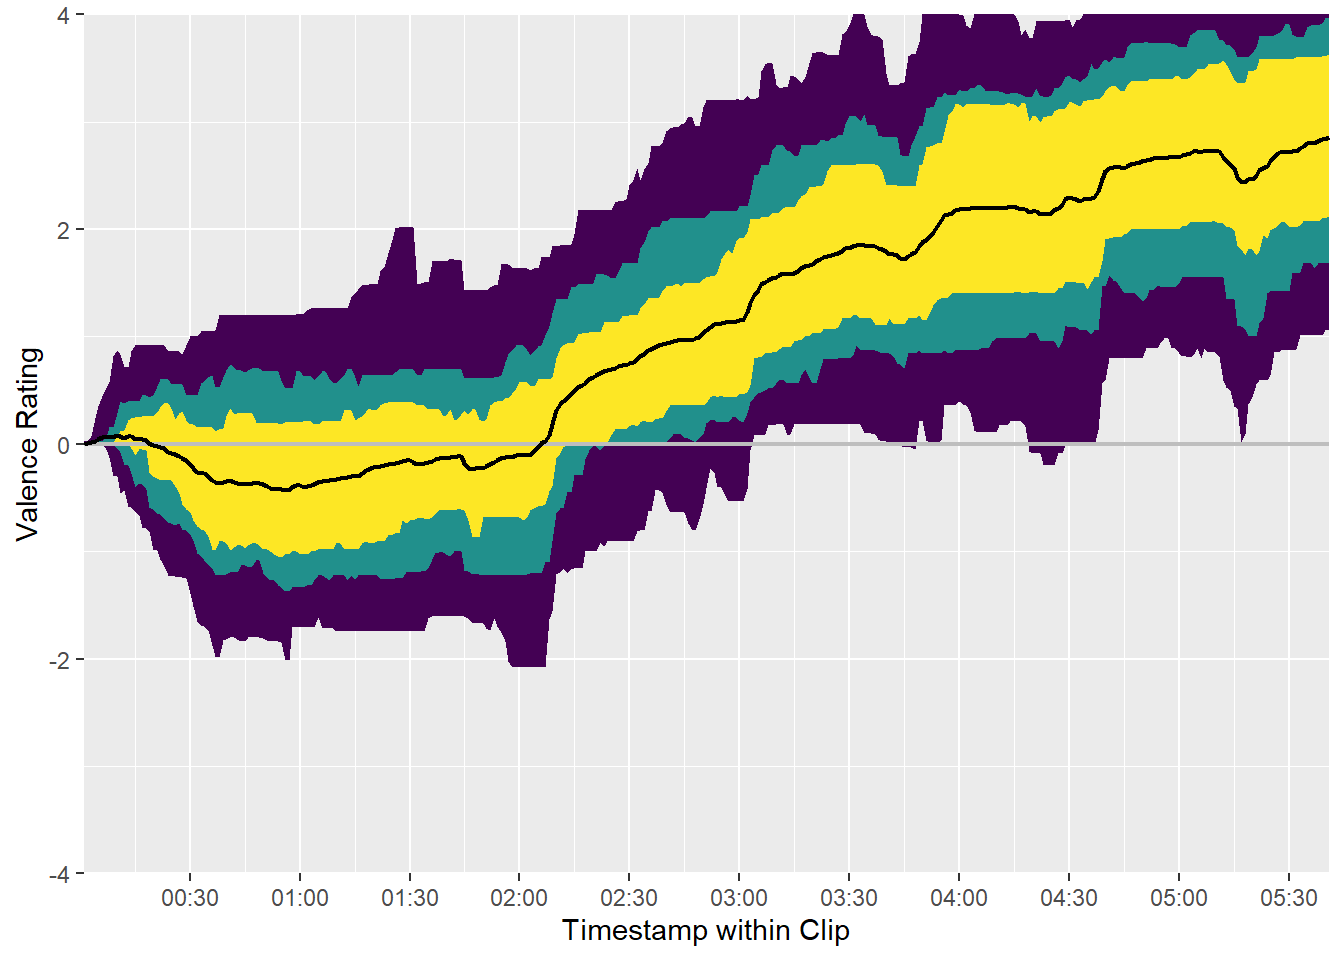
A total of 78 participants watched this film clip and used the CARMA software to provide continuous (i.e., second-by-second) ratings of how it made them feel. These continuous ratings were made on a single emotional valence scale ranging from -4 (very negative) to 4 (very positive).
Time Series
We can plot the distribution of all valence ratings per second of the film clip to get a sense of how its emotional tone changes over time. The solid black line represents the mean of all ratings and the yellow, green, and purple ribbons represent the central 50%, 70%, and 90% of the ratings, respectively.
Inter-Rater Reliability
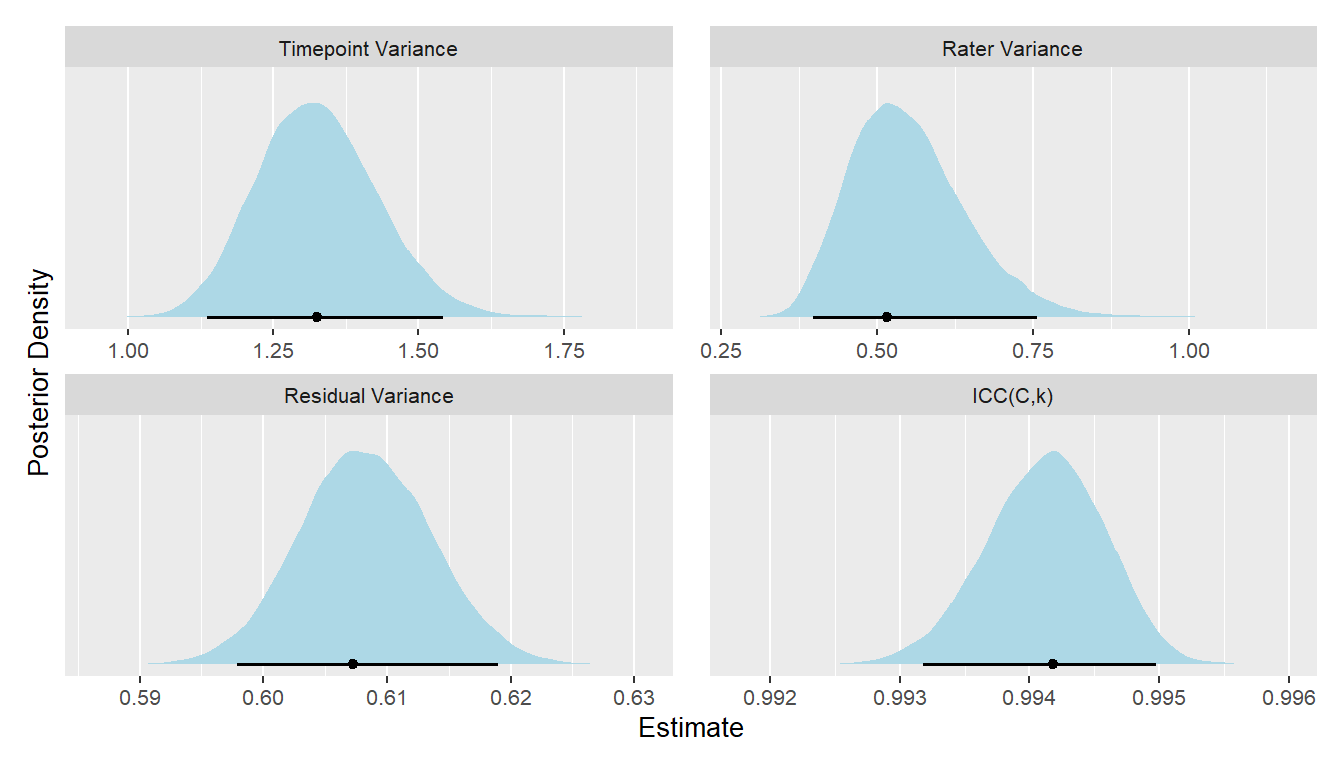
A Bayesian generalizability study was used to decompose the variance in ratings of this video clip into the following components: timepoint variance (in average ratings of each second, across raters), rater variance (in average ratings from each rater, across seconds), and residual variance (including second-by-rater interactions and measurement error). The lower and upper columns in the table below represent the boundaries of the 95% equal-tail credible interval. Note that we dropped the first 10 seconds of each clip (as rater “warmup” time).
| Component | Term | Estimate | Lower | Upper | Percent |
|---|---|---|---|---|---|
| Rater | Variance | 0.516 | 0.397 | 0.756 | 0.211 |
| Timepoint | Variance | 1.326 | 1.135 | 1.543 | 0.541 |
| Residual | Variance | 0.607 | 0.598 | 0.619 | 0.248 |
From these variance components, we can estimate inter-rater reliability of the ratings. There are many formulations of the two-way intraclass correlation (ICC), but the most relevant to our purposes here is the balanced average-measures consistency formulation or ICC(C,k).
| Term | Estimate | Lower | Upper | Raters | Error |
|---|---|---|---|---|---|
| ICC(C,k) | 0.994 | 0.993 | 0.995 | 78 | Relative |
Below, we can also visualize the posterior distributions of each of these parameters. Values with higher posterior density are more probable.