| Abbrev | Film | Clip Start | Clip Stop | Duration |
|---|---|---|---|---|
| ForrestGump | Forrest Gump (1994) | 02:09:19.000 | 02:12:57.000 | 218 |
Forrest Gump
Film Information
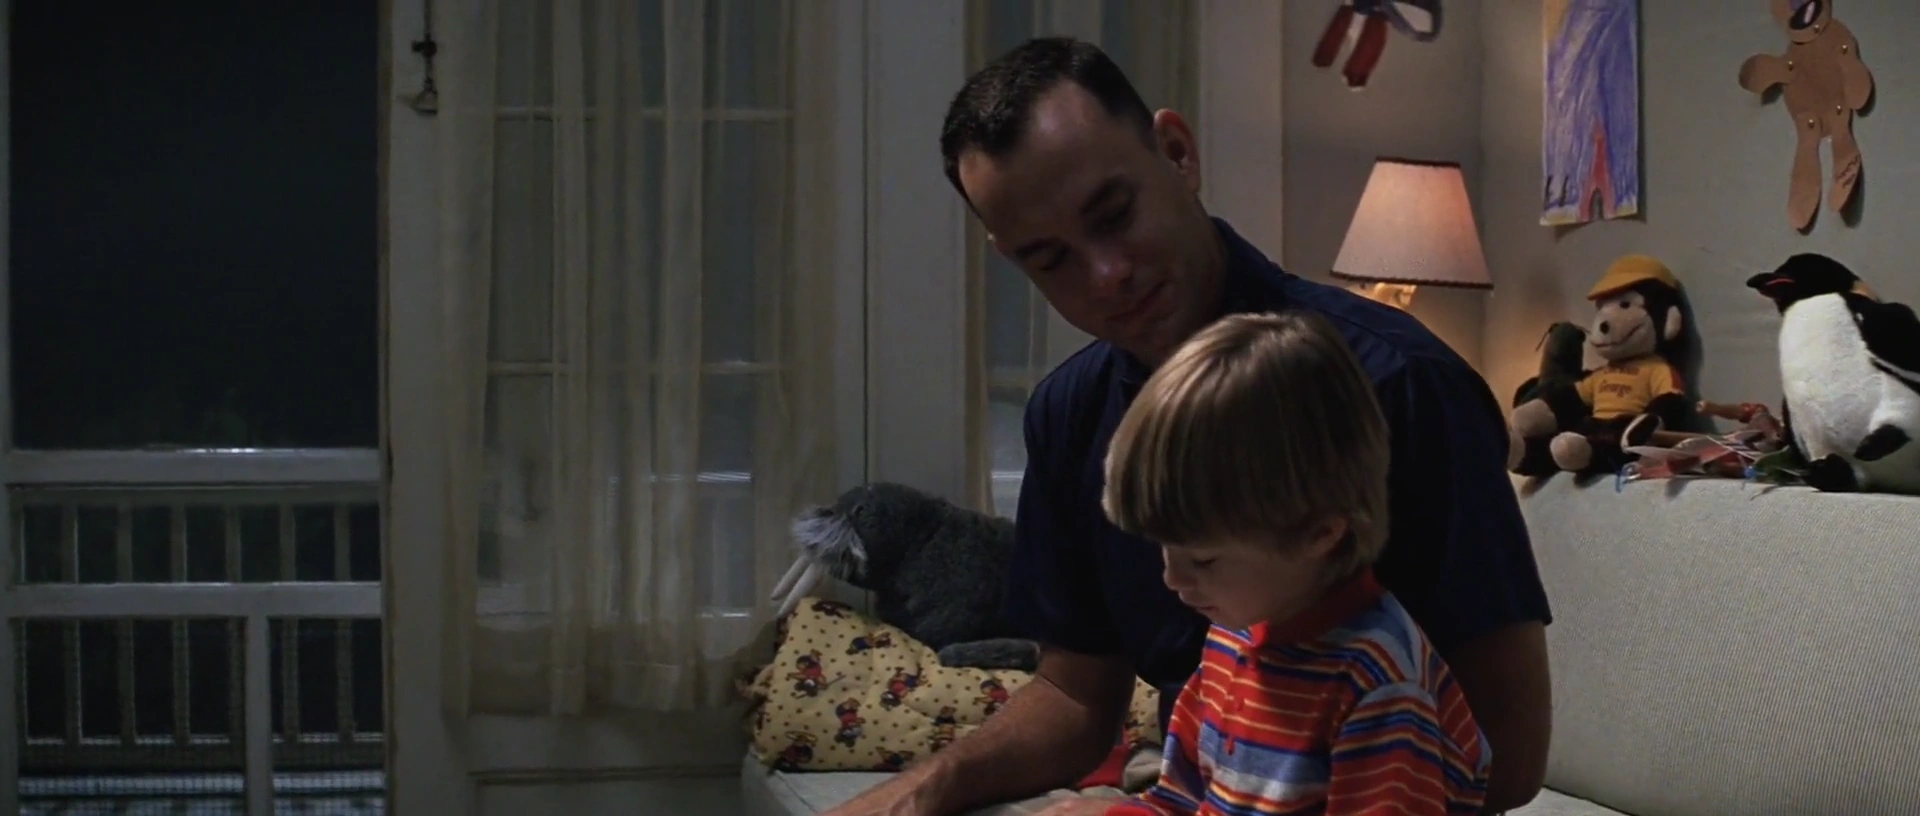
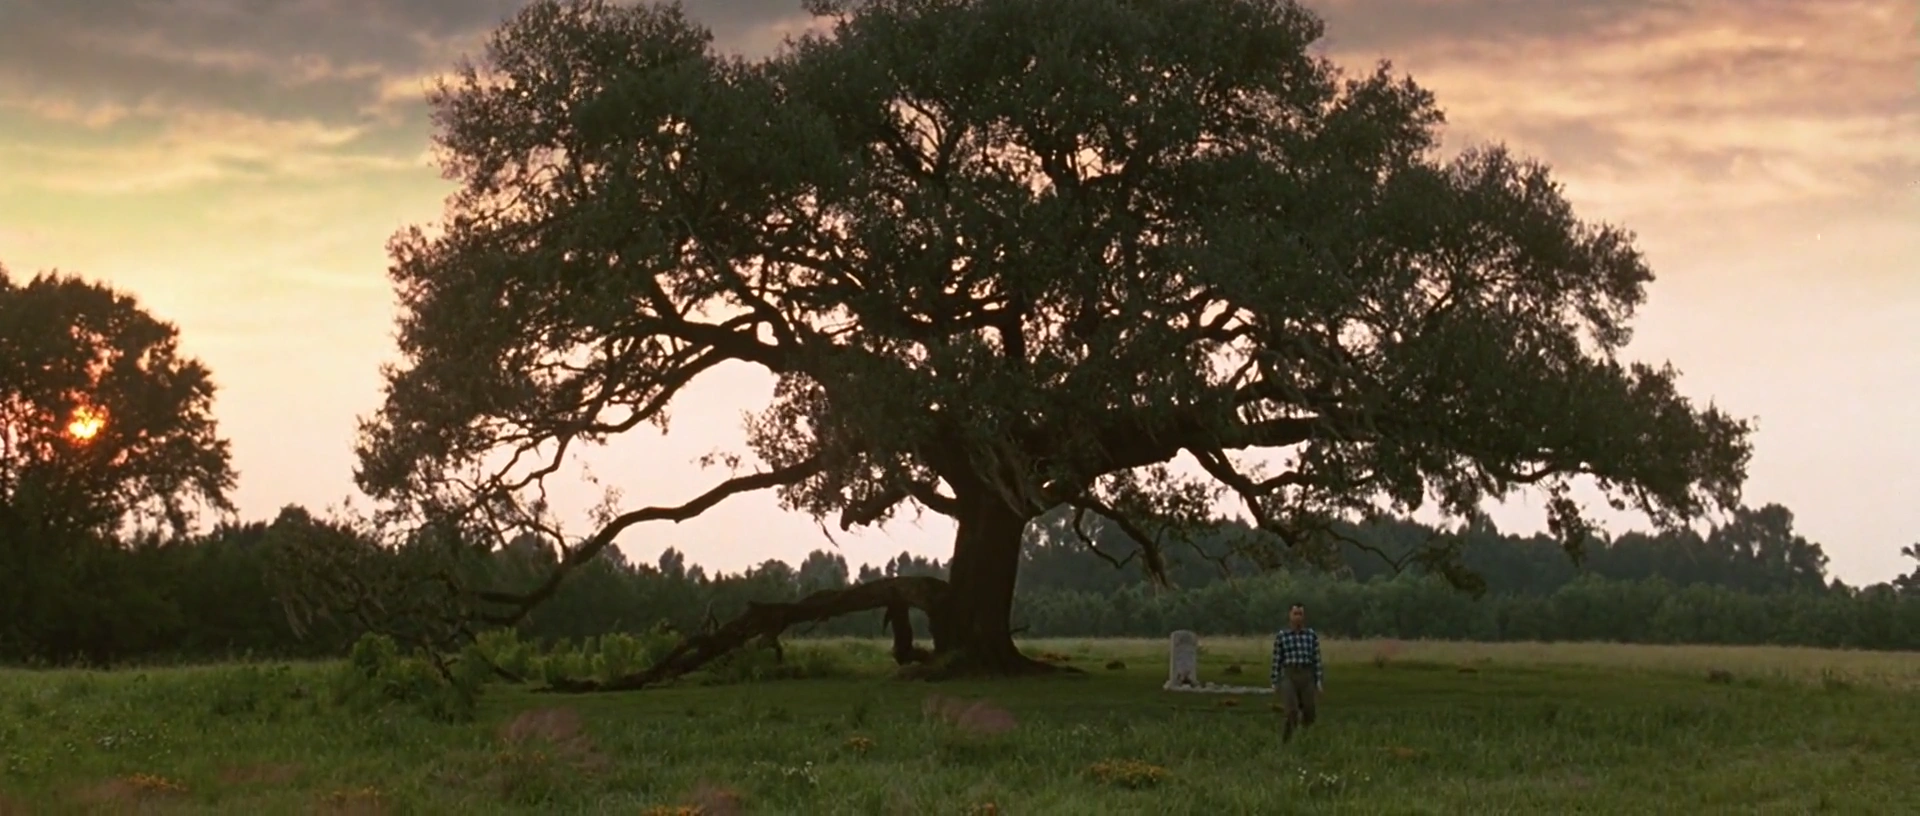
Forrest Gump is a 1994 American comedy-drama film directed by Robert Zemeckis and written by Eric Roth. It is based on the 1986 novel of the same name by Winston Groom and stars Tom Hanks, Robin Wright, Gary Sinise, Mykelti Williamson and Sally Field. The film follows several decades in the life of a slow-witted and kindhearted Alabama man named Forrest Gump (Hanks) and his experiences in the 20th-century United States. The film differs substantially from the novel.
All information in this section came from Wikipedia.
Clip Information
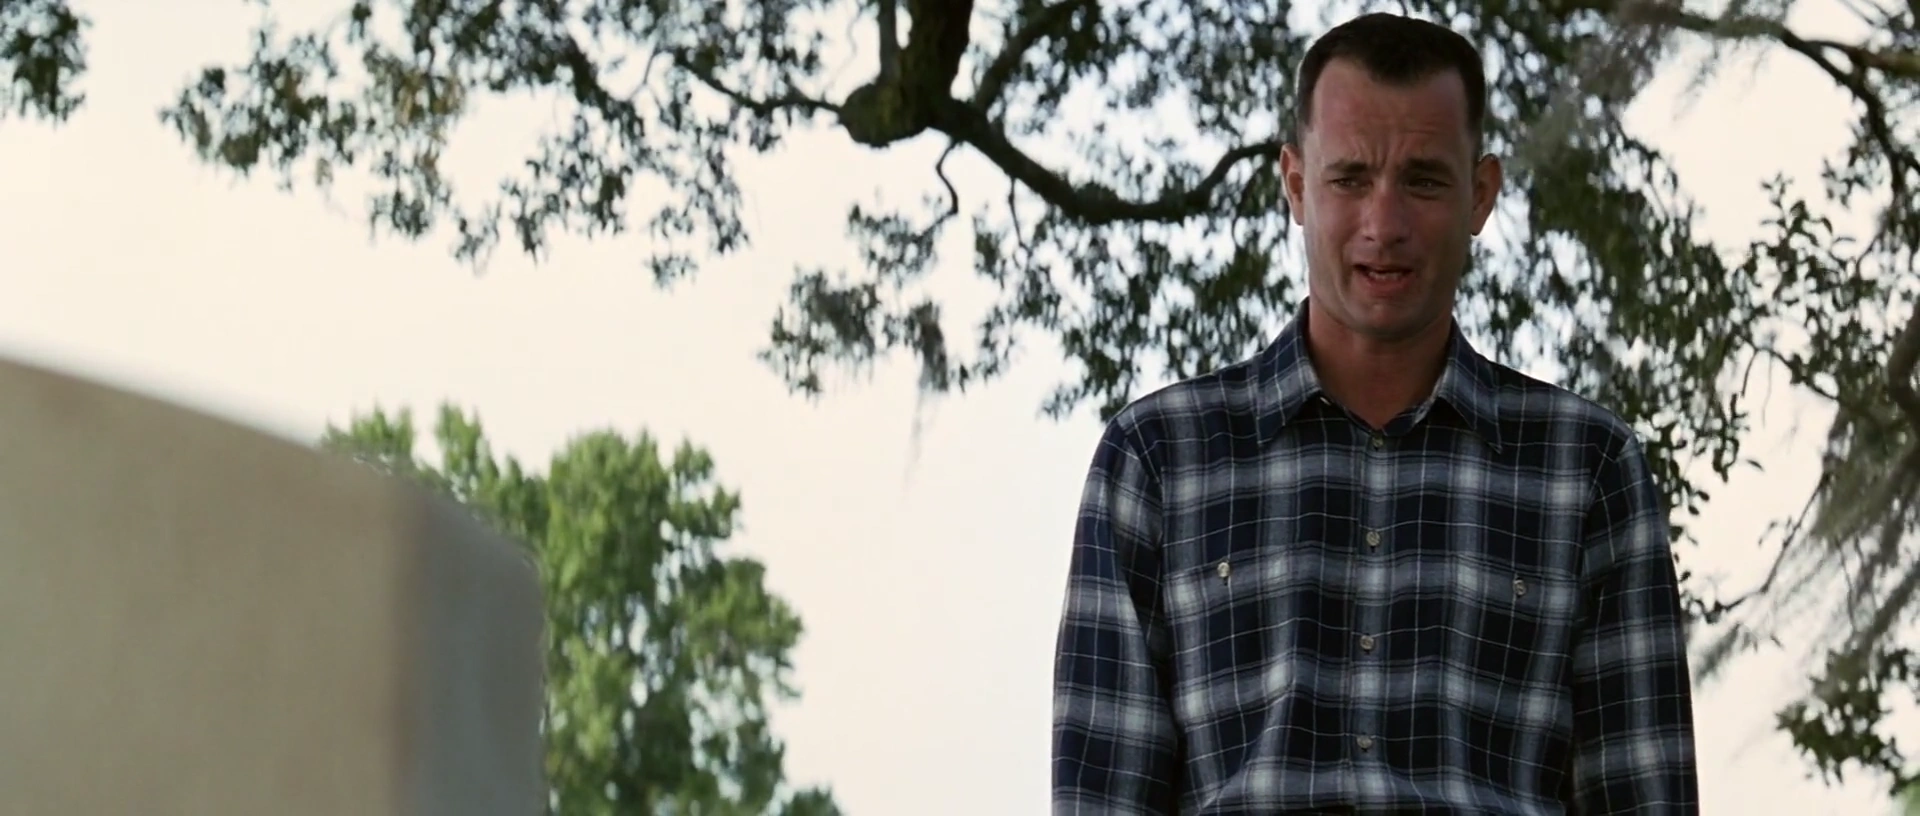
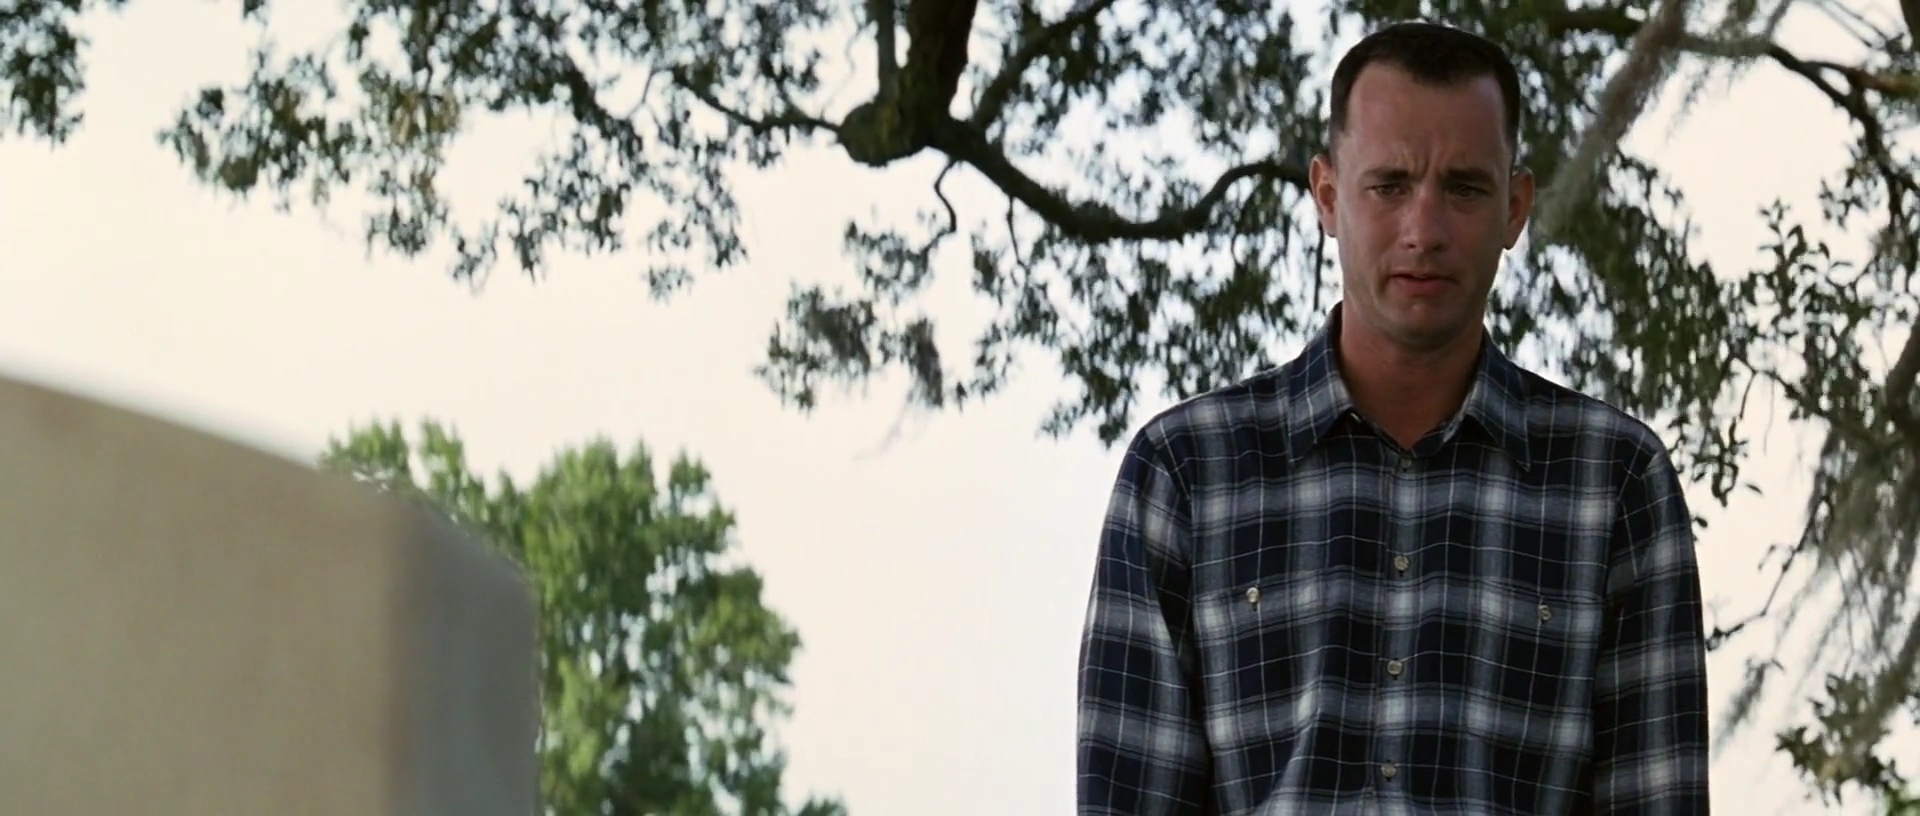
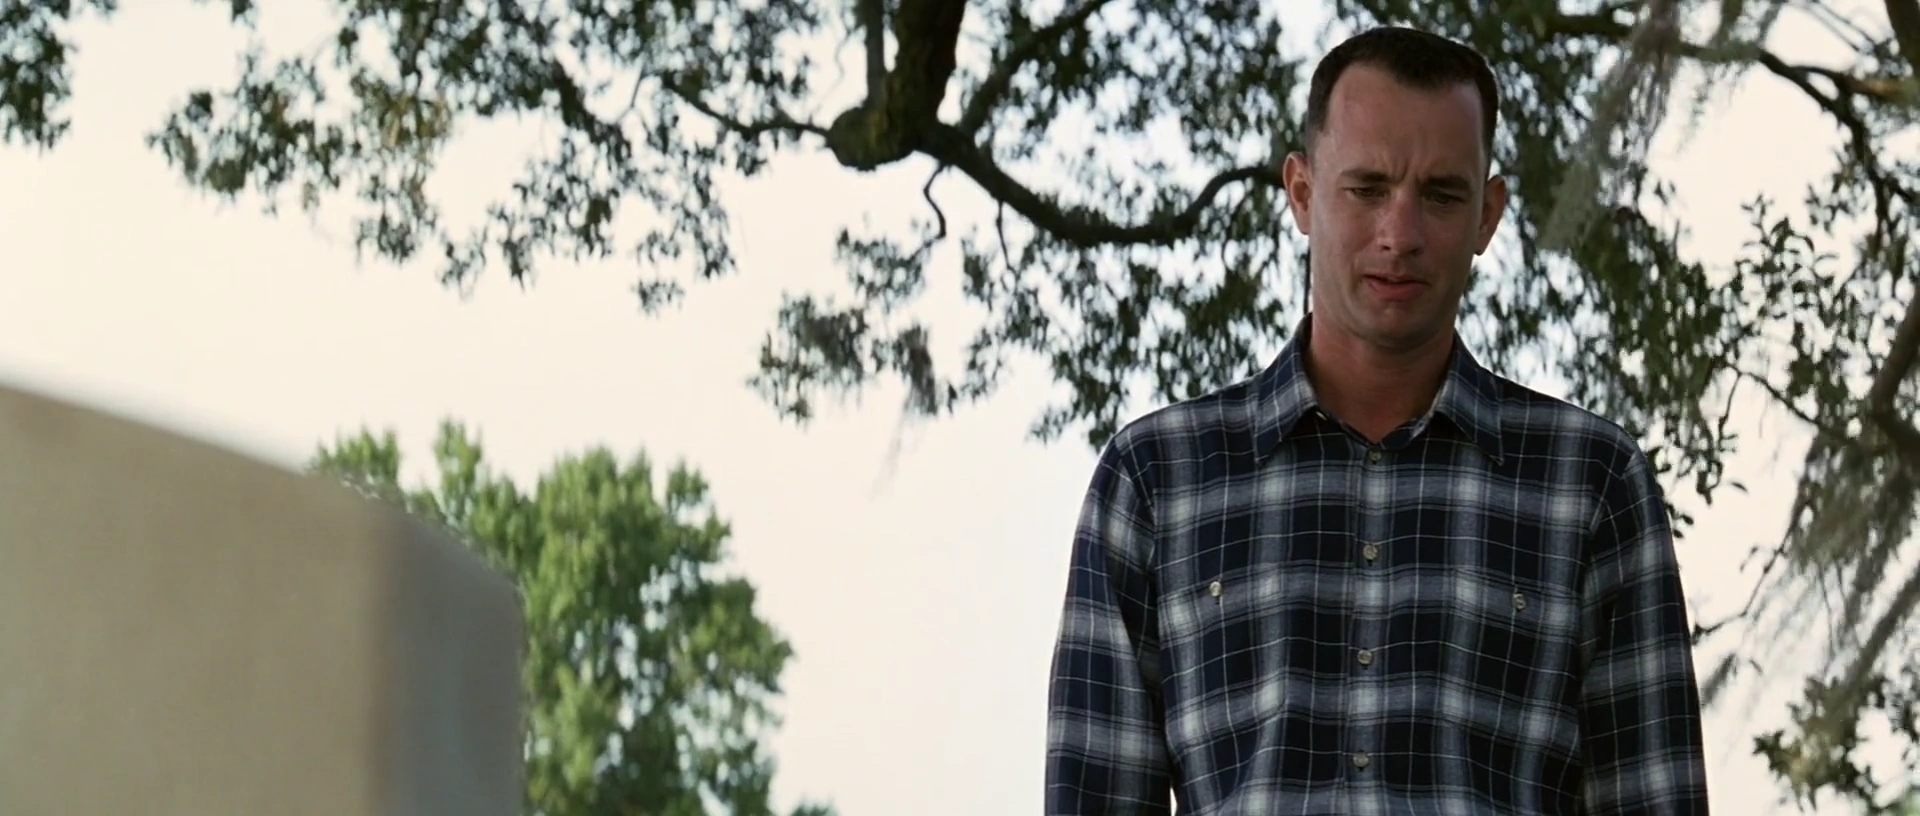
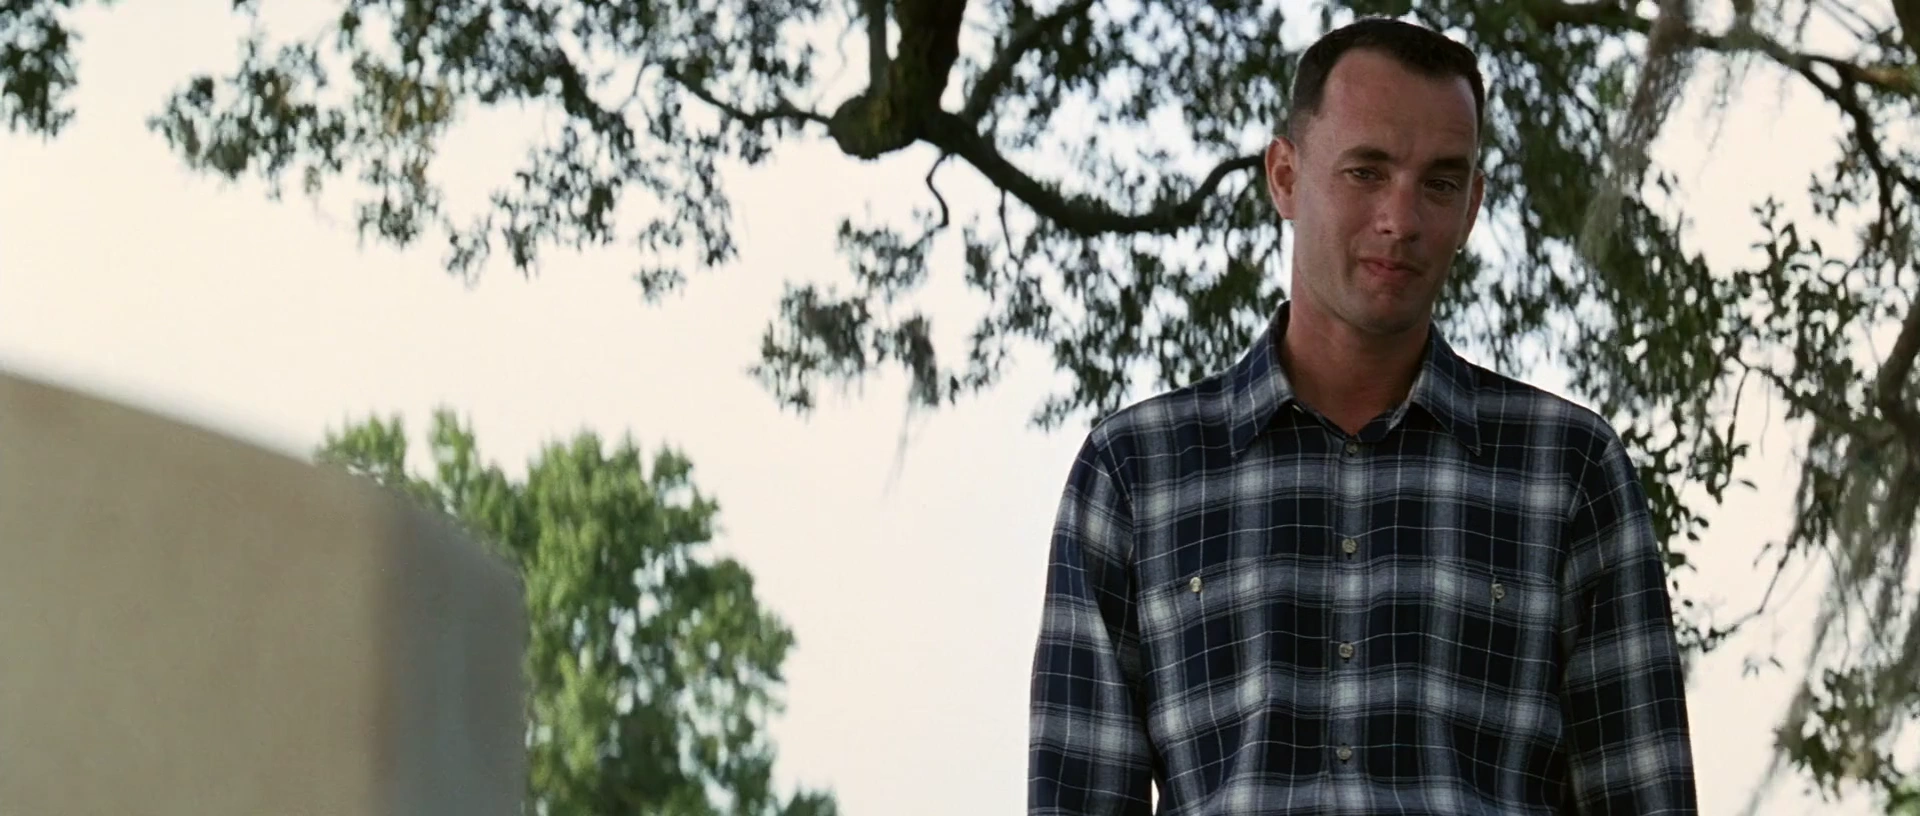
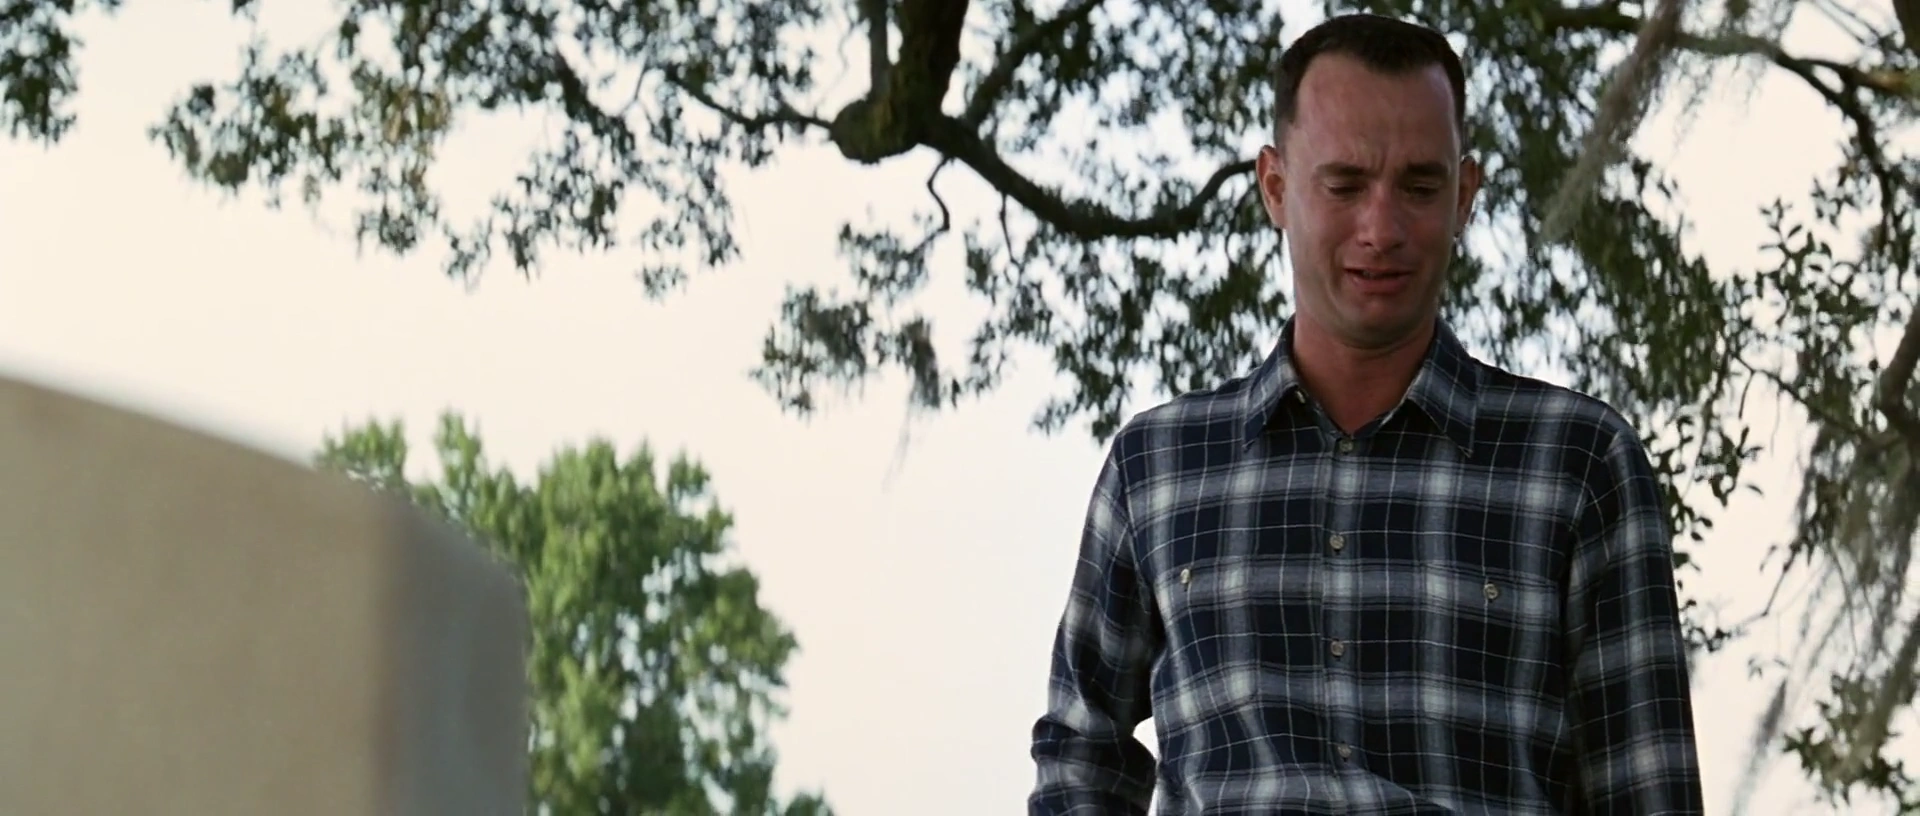
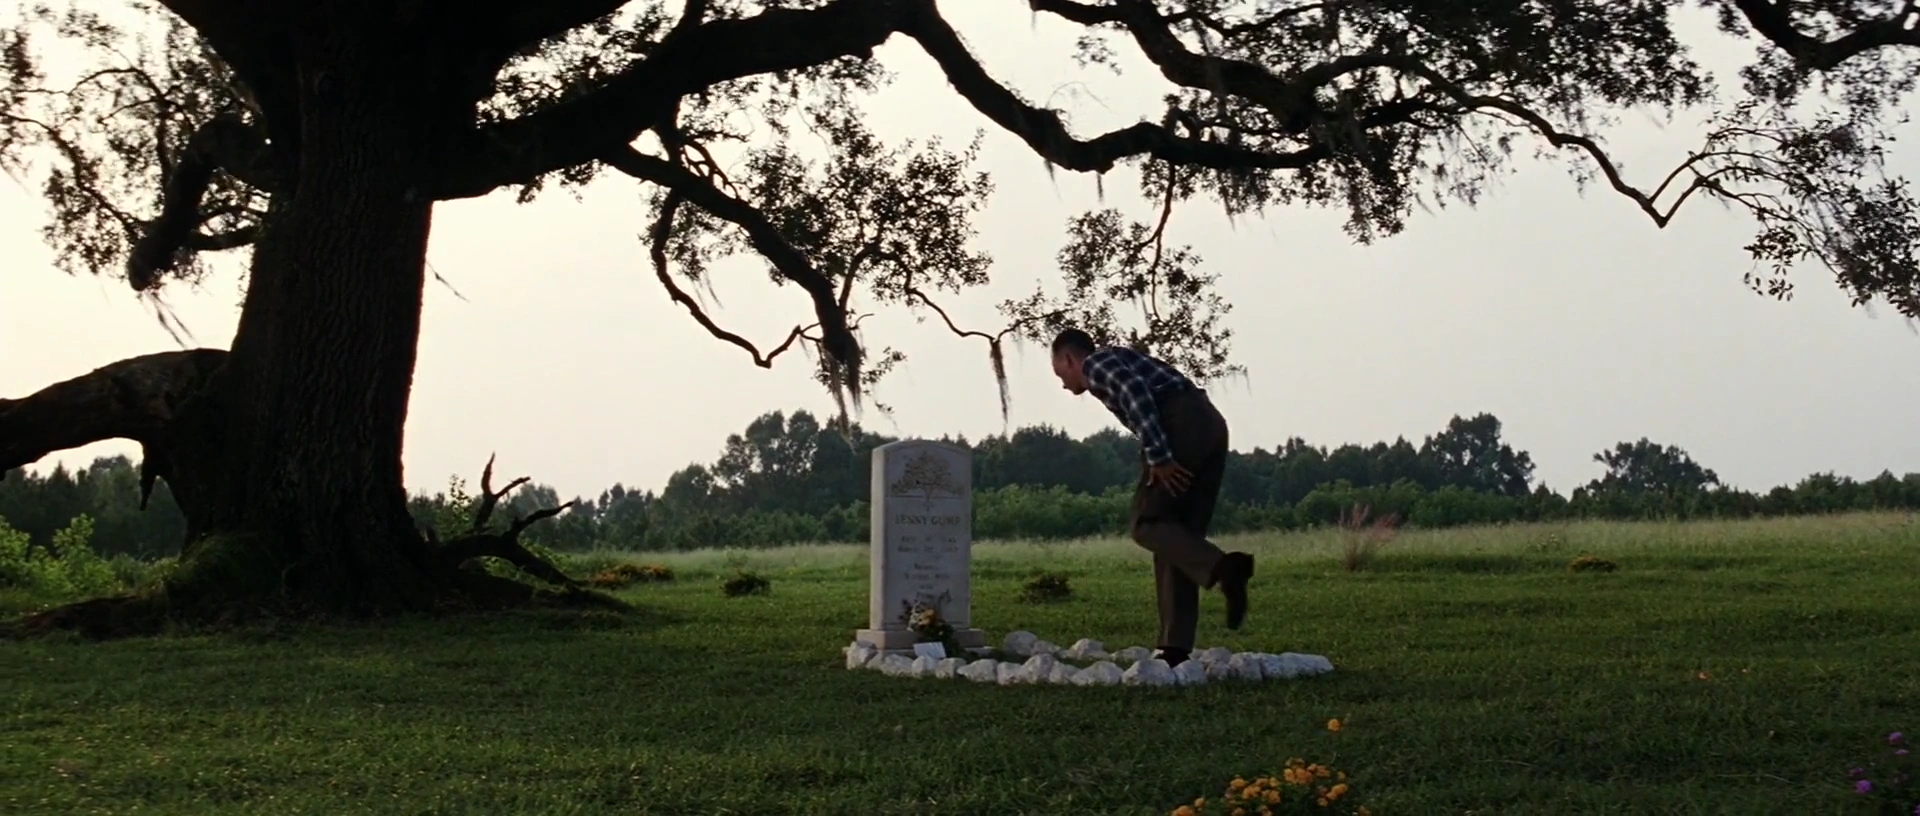
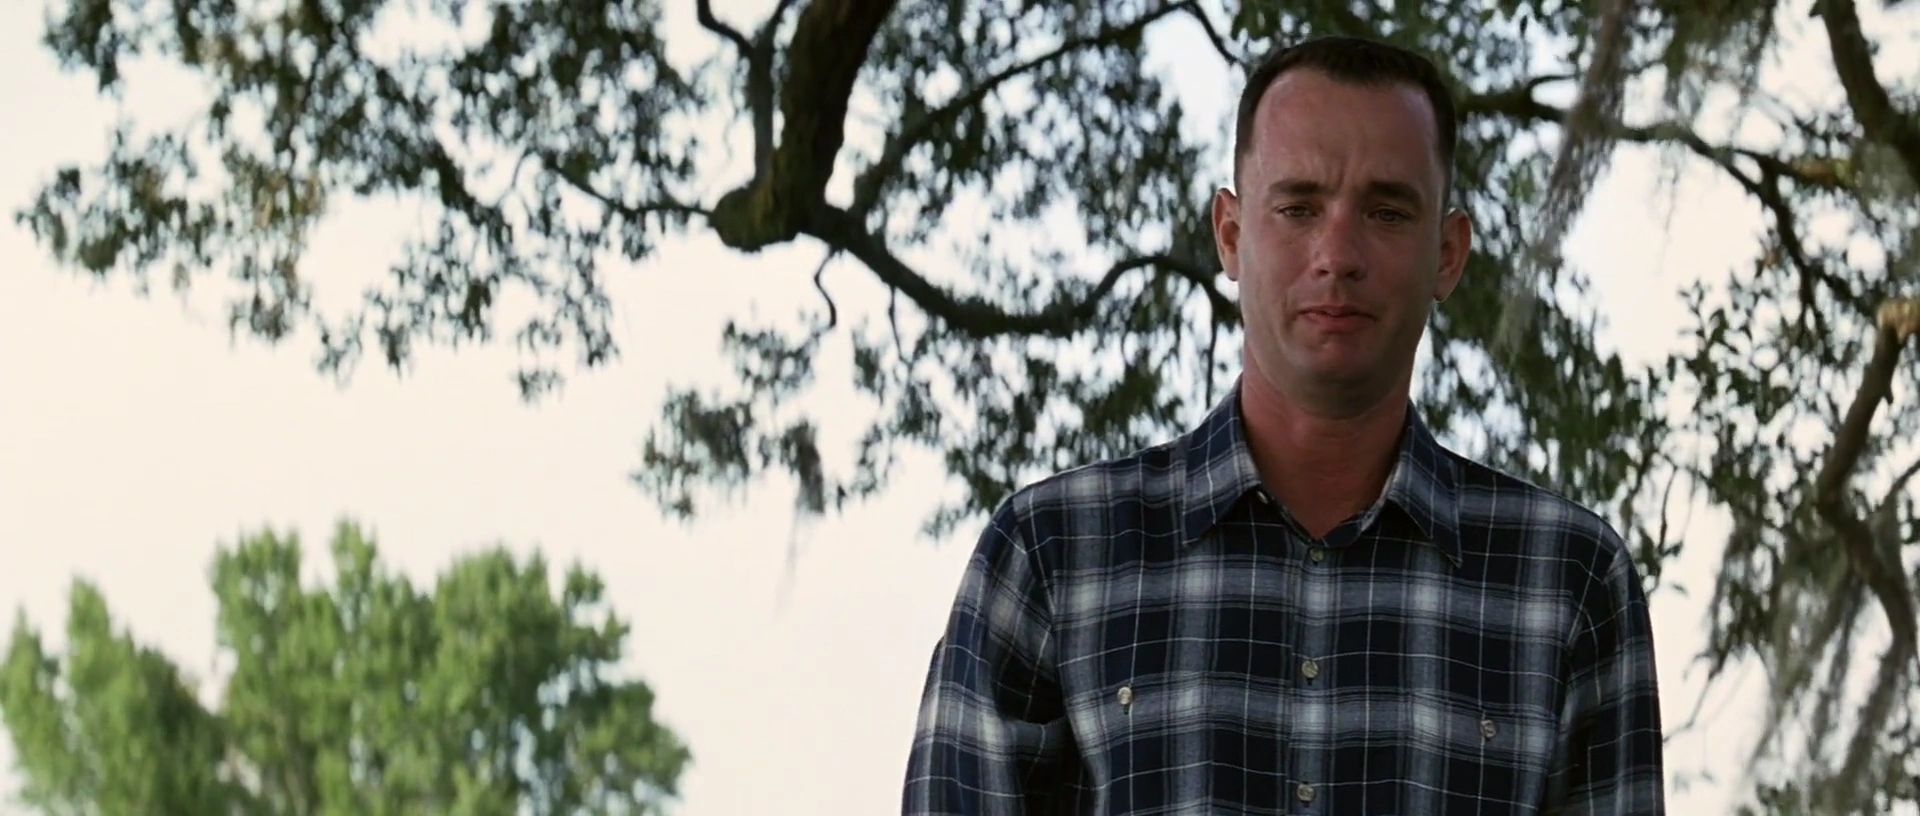
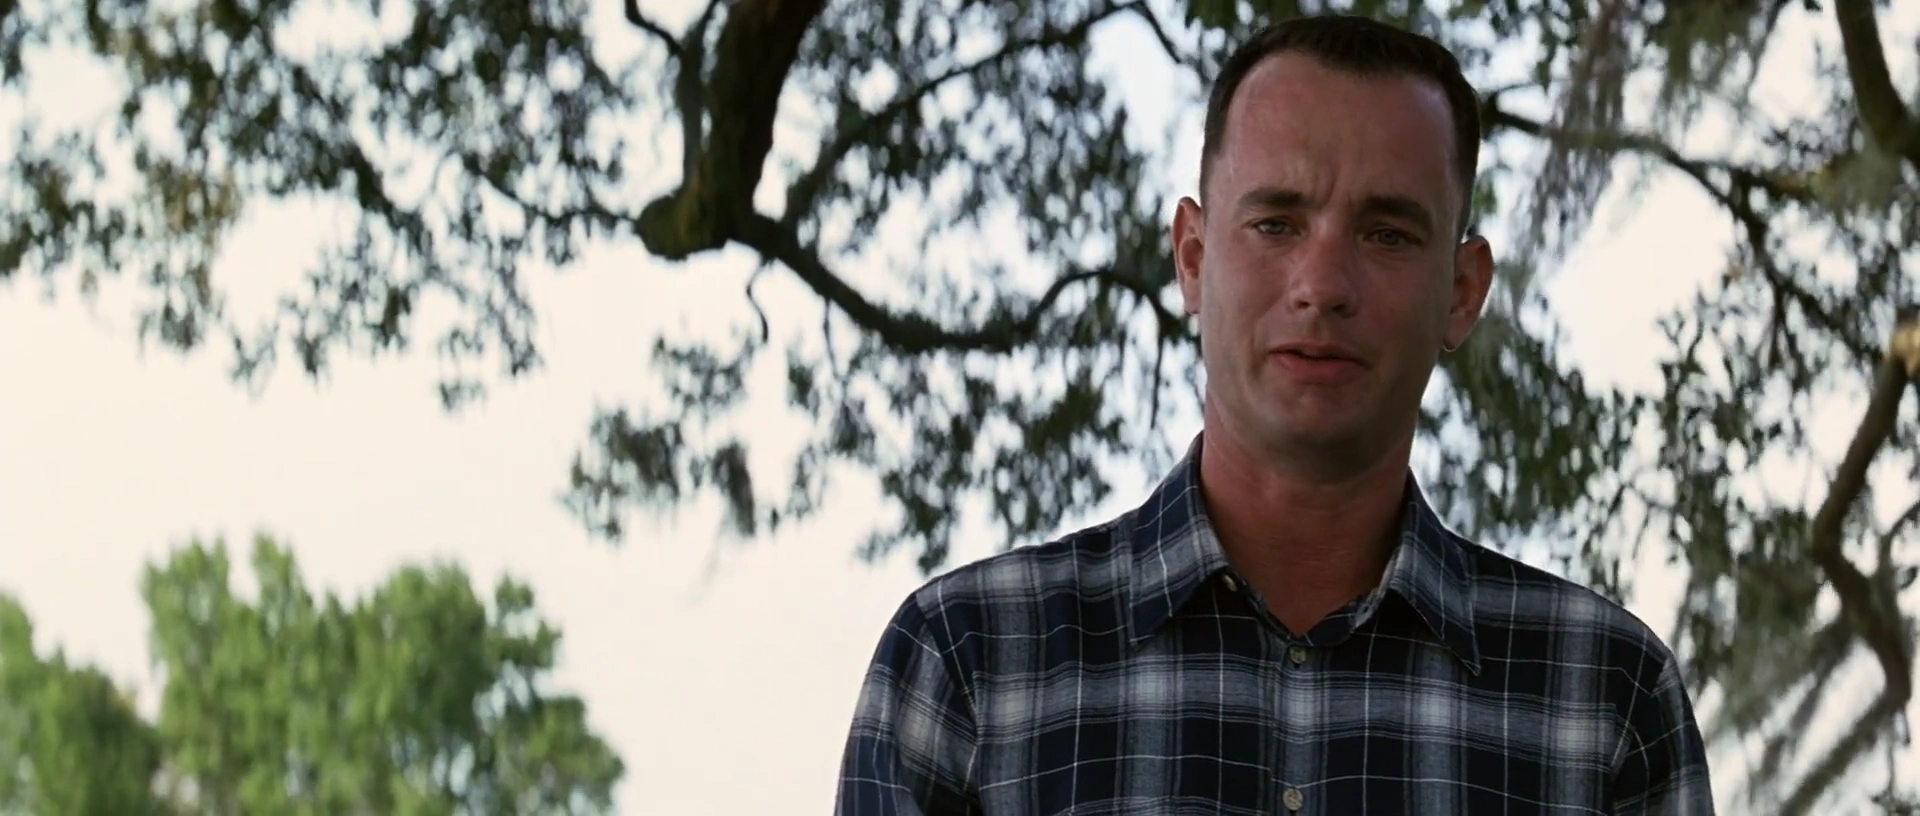
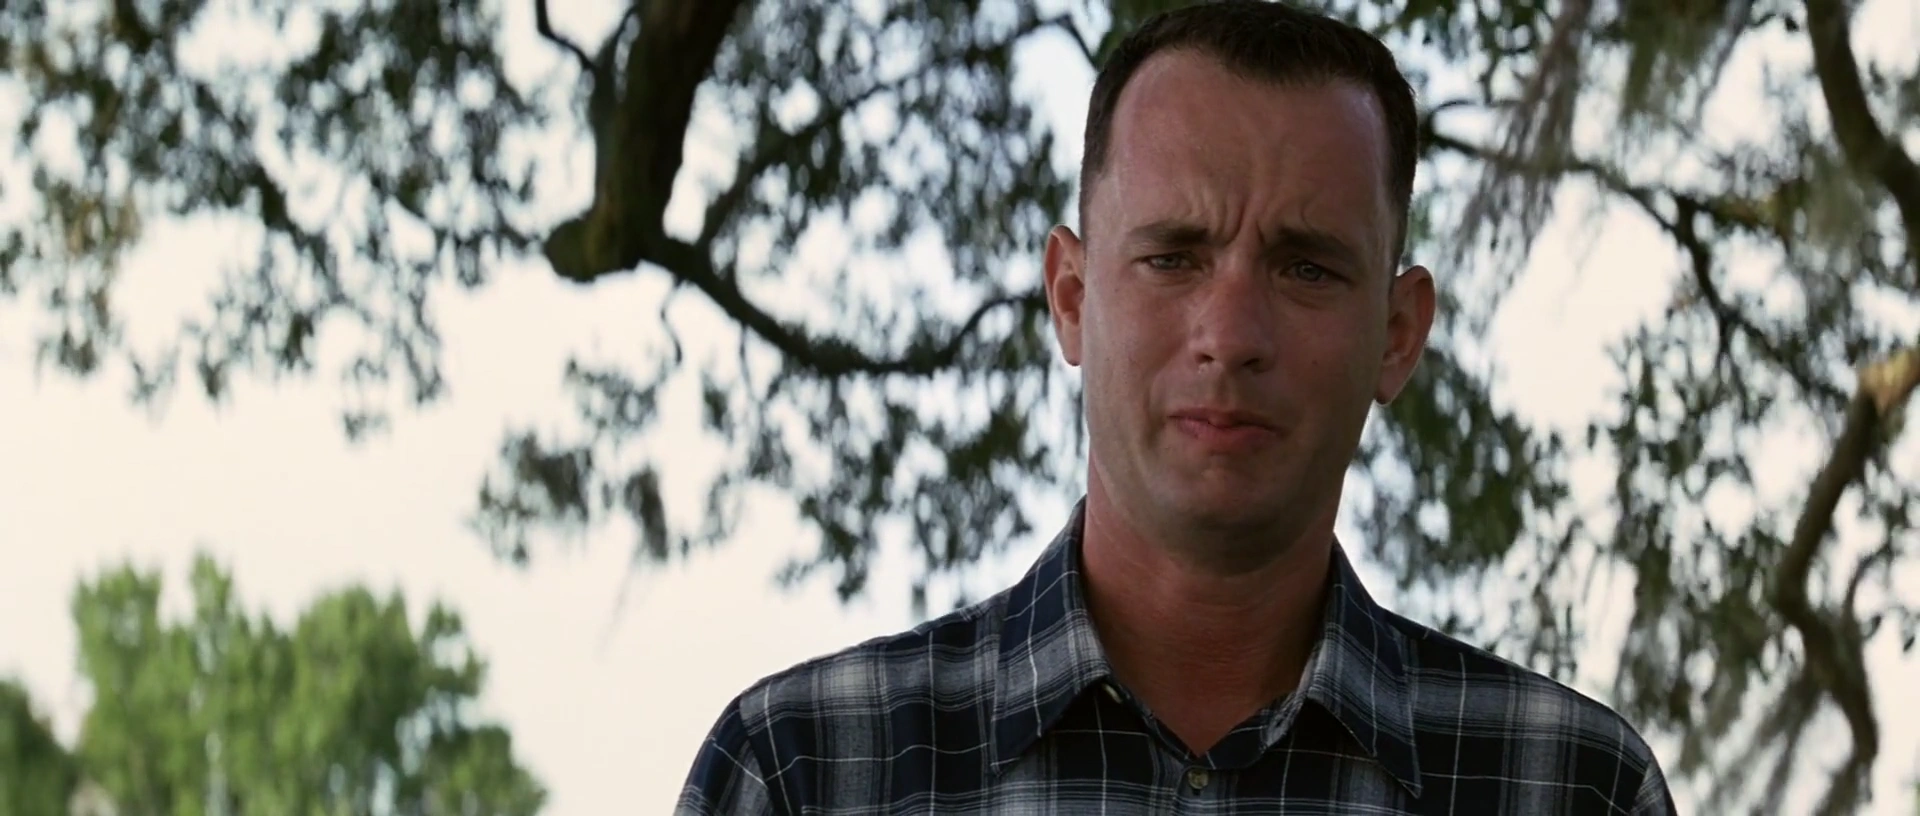
Forrest visits the grave of his wife, Jenny, delivering a letter that their son, little Forrest, wrote to her.
| Characteristic | Value |
|---|---|
| Format | MPEG-4 |
| File Size | 75.1 MiB |
| Duration | 218.01 |
| Frame Rate | 23.976 |
| Video Width | 1920 |
| Video Height | 816 |
| Video BitRate | 2.8 MB/s |
| Audio Channels | 2 |
| Audio SamplingRate | 48000 |
| Audio BitRate | 128.2 kB/s |

Subtitles
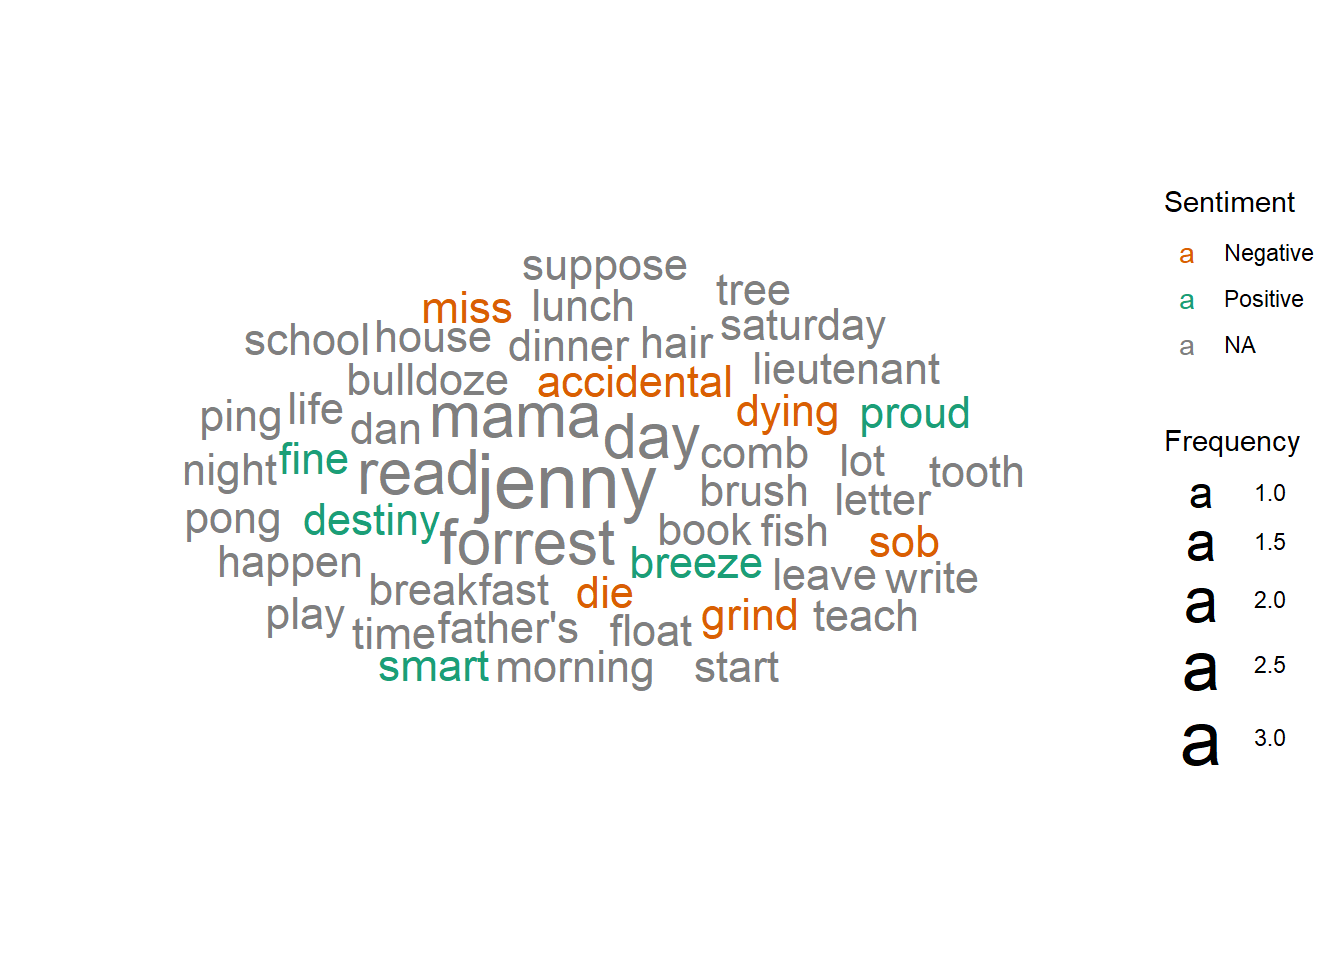
The following wordcloud shows the words used in this clip, scaled by number of occurrences and colored by sentiment (orange = negative, green = positive, grey = neutral or unsure). Note that the words have been stemmed and lemmatized and stopwords have been removed.
The table below shows all subtitles in this clip with the start and stop time of each subtitle’s appearance in seconds.
| Start | End | Subtitle |
|---|---|---|
| 3.020 | 6.355 | You died on a Saturday morning. |
| 8.066 | 11.819 | And I had you placed here under our tree. |
| 16.700 | 21.537 | And I had that house of your father's bulldozed to the ground. |
| 25.667 | 27.335 | Mama |
| 28.420 | 33.424 | always said that dying was a part of life. |
| 36.845 | 39.180 | I sure wish it wasn't. |
| 41.850 | 45.603 | Little Forrest is doing just fine. |
| 46.938 | 48.022 | But... |
| 48.273 | 50.941 | About to start school again soon, |
| 52.778 | 56.571 | and I make his breakfast, lunch and dinner every day. |
| 58.741 | 64.746 | I make sure he combs his hair and brushes his teeth every day. |
| 67.875 | 70.460 | Teaching him how to play Ping-Pong. |
| 71.754 | 72.796 | Okay. |
| 73.047 | 74.214 | He's really good. |
| 74.298 | 76.424 | Forrest, you go. |
| 80.638 | 82.222 | We fish a lot. |
| 85.768 | 89.229 | (SOBBING) And every night, we read a book. He's so smart, Jenny. |
| 92.483 | 94.734 | You'd be so proud of him. |
| 96.445 | 97.904 | I am. |
| 98.948 | 102.158 | He wrote you a letter. |
| 103.744 | 105.787 | And he says I can't read it. |
| 105.913 | 109.457 | I'm not supposed to, so I'll just leave it here for you. |
| 125.516 | 126.850 | Jenny, |
| 132.648 | 135.859 | I don't know if Mama was right, |
| 137.194 | 138.695 | or if it's Lieutenant Dan. |
| 138.821 | 141.406 | I don't know |
| 141.490 | 145.994 | if we each have a destiny, |
| 148.038 | 153.168 | or if we're all just floating around accidental-like on a breeze. |
| 157.673 | 159.507 | But I think |
| 161.385 | 163.178 | maybe it's both. |
| 167.516 | 170.393 | Maybe both is happening at the same time. |
| 176.525 | 178.526 | But I miss you, Jenny. |
| 184.909 | 189.329 | If there's anything you need, I won't be far away. |
Holistic Ratings
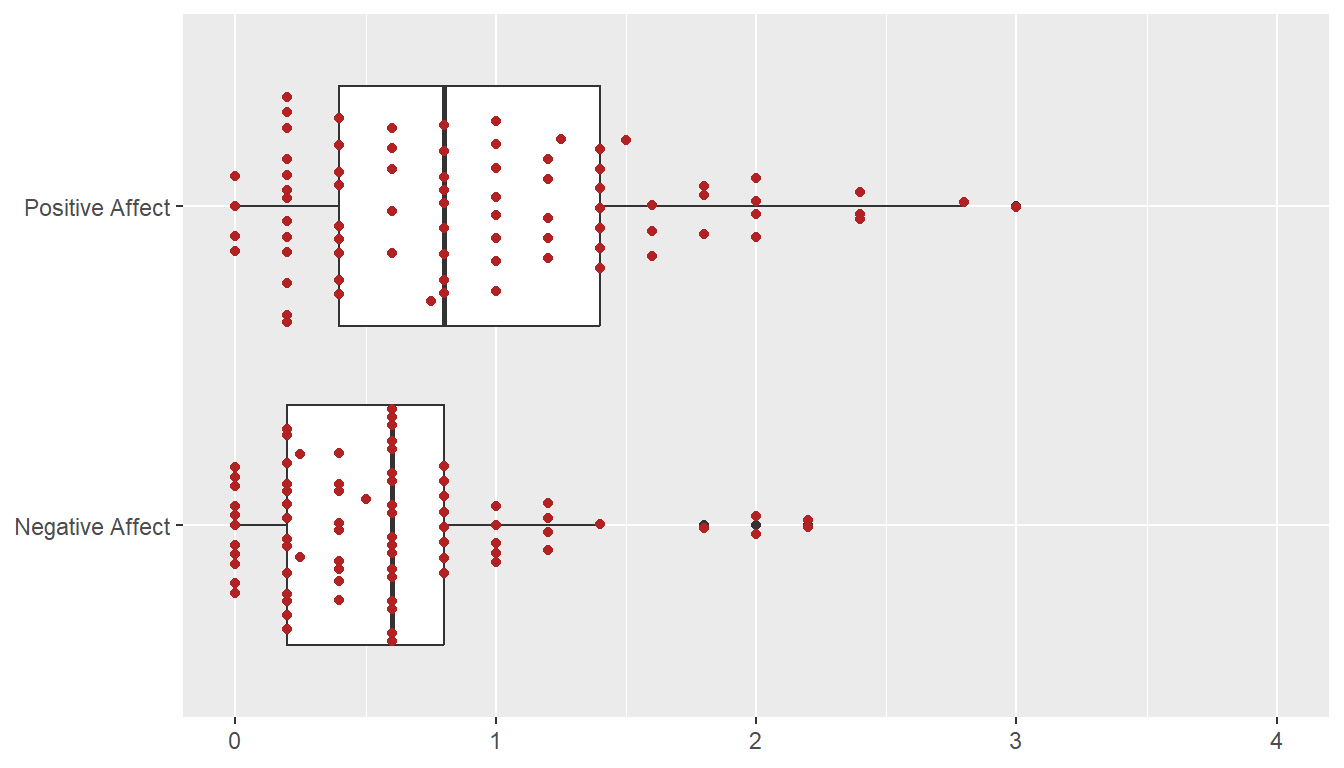
A total of 78 participants watched this film clip and then provided holistic ratings on how the entire clip made them feel. These holistic ratings were completed using five Positive Affect items (i.e., alert, determined, enthusiastic, excited, inspired) and five Negative Affect items (i.e., afraid, distressed, nervous, scared, upset), each rated on an ordinal scale from 0 to 4. The plot below shows the
Dynamic Ratings
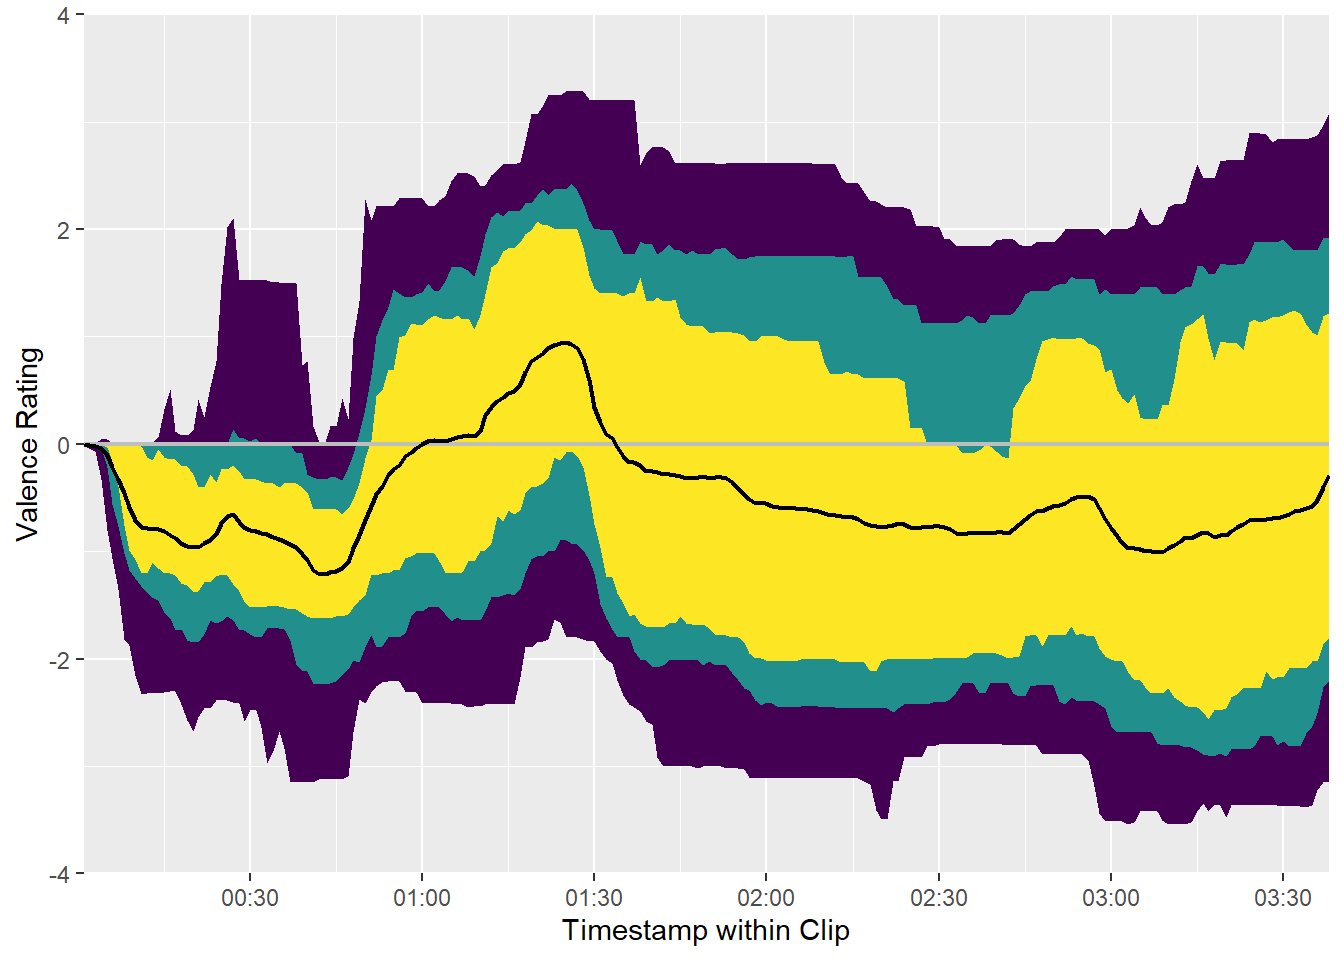
A total of 78 participants watched this film clip and used the CARMA software to provide continuous (i.e., second-by-second) ratings of how it made them feel. These continuous ratings were made on a single emotional valence scale ranging from -4 (very negative) to 4 (very positive).
Time Series
We can plot the distribution of all valence ratings per second of the film clip to get a sense of how its emotional tone changes over time. The solid black line represents the mean of all ratings and the yellow, green, and purple ribbons represent the central 50%, 70%, and 90% of the ratings, respectively.
Inter-Rater Reliability
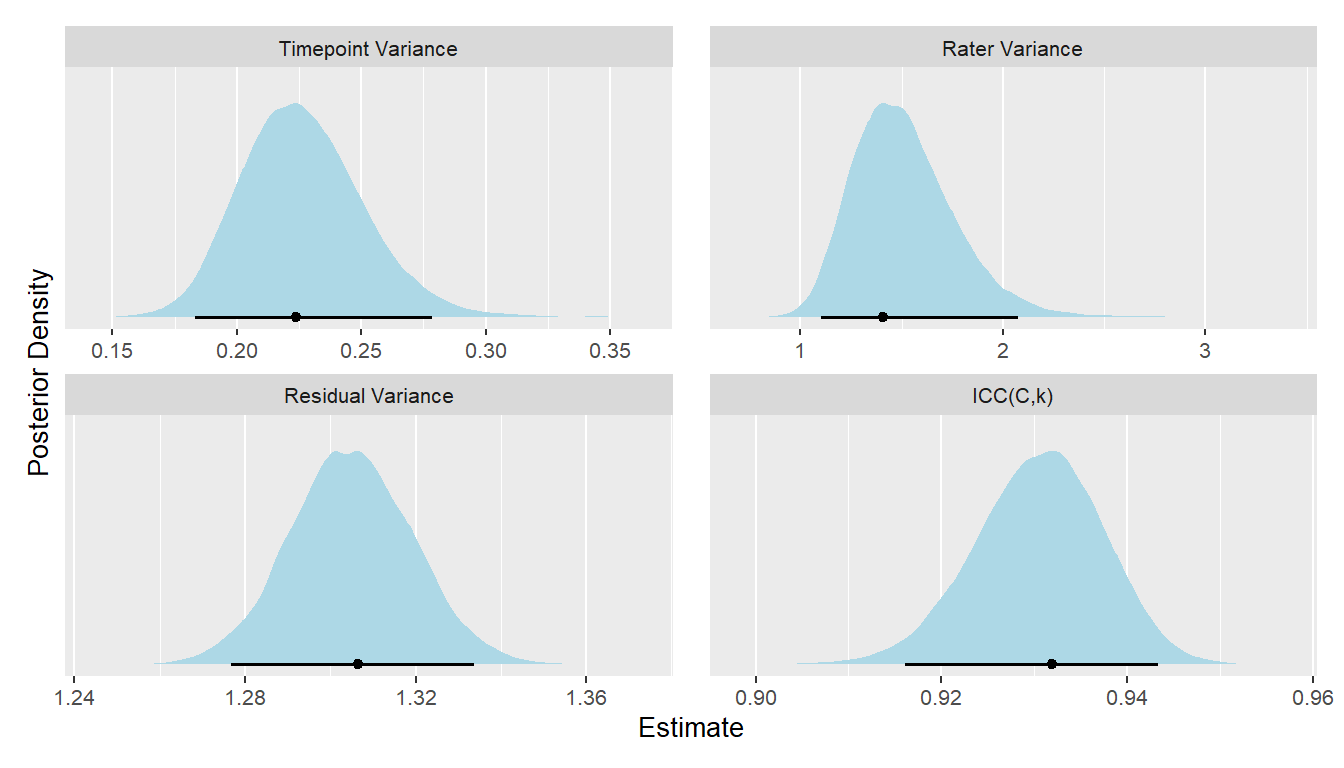
A Bayesian generalizability study was used to decompose the variance in ratings of this video clip into the following components: timepoint variance (in average ratings of each second, across raters), rater variance (in average ratings from each rater, across seconds), and residual variance (including second-by-rater interactions and measurement error). The lower and upper columns in the table below represent the boundaries of the 95% equal-tail credible interval. Note that we dropped the first 10 seconds of each clip (as rater “warmup” time).
| Component | Term | Estimate | Lower | Upper | Percent |
|---|---|---|---|---|---|
| Rater | Variance | 1.408 | 1.104 | 2.074 | 0.479 |
| Timepoint | Variance | 0.224 | 0.183 | 0.279 | 0.076 |
| Residual | Variance | 1.306 | 1.277 | 1.334 | 0.445 |
From these variance components, we can estimate inter-rater reliability of the ratings. There are many formulations of the two-way intraclass correlation (ICC), but the most relevant to our purposes here is the balanced average-measures consistency formulation or ICC(C,k).
| Term | Estimate | Lower | Upper | Raters | Error |
|---|---|---|---|---|---|
| ICC(C,k) | 0.932 | 0.916 | 0.943 | 78 | Relative |
Below, we can also visualize the posterior distributions of each of these parameters. Values with higher posterior density are more probable.